I've put together an all SSD array with invaluable help from this board. With the system now up, I though it made more sense to start a new thread here documenting testing. I thought folks might be interested in how an array like this performs. My use case is as an iSCSI target for ESXi, but before this goes into production I'm happy to do other testing if it would be interesting to people. I'd also, of course, appreciate thoughts on improving performance.
Here's the system specs:
Chasis: SUPERMICRO CSE-216BE2C-R920LPB
Motherboard: SUPERMICRO MBD-X10SRH-CLN4F-O (HBA is an onboard LSI 3008 flashed to IT mode)
CPU: Xeon E5-1650v4
RAM: 4x32GB Samsung DDR4-2400
Boot Drive: Two mirrored SSD-DM064-SMCMVN1 (64GB DOM)
SLOG: Intel P4800X (my performance on that is posted on the SLOG benchmarking thread)
Array Drives - 8 x Samsung 883 DCT 1.92 TB
Network - Chelsio T520-BT
The setup is FreeNAS 11.2-u4 on baremetal. The array is 4 vdevs of two-wide mirrors.
Here's how the drives look (I tested them all and they all have nearly identical results):
Here's some raw dd read and writes (compression turned off, of course). Sync is set to "always" for the dataset:
and here are the write speeds (these are mirrored vdevs):
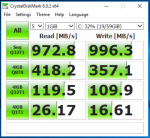
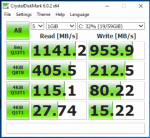
And here's performance on Windows 10 VM (8 vCPUs, 8GB RAM) using this as an iSCSI target over a 10Gb link (single):

The top and bottom tests seem correct. The top one is just maxing out the 10Gb link on a sequential read/write. The bottom seems more or less consistent with the single drive performance on 4k random i/o shown above with diskinfo.
Less sure about the middle two tests, especially the 8Q/8T one. I played with different thread and queue counts to see if I could push the speed higher but I seem to be maxed out on the 8T/8Q test--that comes out to roughly 100k IOPS. These drives - Samsung 883 DCT -- are spec'd at 98k IOPS read/28k IOPs write. I'm running 2 wide mirror/4 devs so I think that explain my writes maxing out at around 100k IOPs (~28k x 4). Not sure why I can't get higher reads.
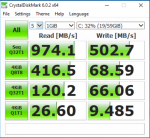
Also, I tried the same test on an NFS share on the same array (dataset has sync set as Always as well). Interestingly, the write speeds dropped off. Not sure why:

Here's the system specs:
Chasis: SUPERMICRO CSE-216BE2C-R920LPB
Motherboard: SUPERMICRO MBD-X10SRH-CLN4F-O (HBA is an onboard LSI 3008 flashed to IT mode)
CPU: Xeon E5-1650v4
RAM: 4x32GB Samsung DDR4-2400
Boot Drive: Two mirrored SSD-DM064-SMCMVN1 (64GB DOM)
SLOG: Intel P4800X (my performance on that is posted on the SLOG benchmarking thread)
Array Drives - 8 x Samsung 883 DCT 1.92 TB
Network - Chelsio T520-BT
The setup is FreeNAS 11.2-u4 on baremetal. The array is 4 vdevs of two-wide mirrors.
Here's how the drives look (I tested them all and they all have nearly identical results):
Code:
root@freenas[~]# diskinfo -wS /dev/da7
/dev/da7
        512             # sectorsize
        1920383410176   # mediasize in bytes (1.7T)
        3750748848      # mediasize in sectors
        4096            # stripesize
        0               # stripeoffset
        233473          # Cylinders according to firmware.
        255             # Heads according to firmware.
        63              # Sectors according to firmware.
        ATA SAMSUNG MZ7LH1T9    # Disk descr.
        S455NY0M210671          # Disk ident.
        id1,enc@n500304801f1e047d/type@0/slot@8/elmdesc@Slot07  # Physical path
        Yes             # TRIM/UNMAP support
        0               # Rotation rate in RPM
        Not_Zoned       # Zone Mode

Synchronous random writes:
         0.5 kbytes:    125.2 usec/IO =      3.9 Mbytes/s
           1 kbytes:    124.1 usec/IO =      7.9 Mbytes/s
           2 kbytes:    126.5 usec/IO =     15.4 Mbytes/s
           4 kbytes:    130.9 usec/IO =     29.8 Mbytes/s
           8 kbytes:    138.9 usec/IO =     56.2 Mbytes/s
          16 kbytes:    153.3 usec/IO =    101.9 Mbytes/s
          32 kbytes:    196.6 usec/IO =    158.9 Mbytes/s
          64 kbytes:    275.3 usec/IO =    227.0 Mbytes/s
         128 kbytes:    422.3 usec/IO =    296.0 Mbytes/s
         256 kbytes:    722.0 usec/IO =    346.2 Mbytes/s
         512 kbytes:   1342.7 usec/IO =    372.4 Mbytes/s
        1024 kbytes:   2543.1 usec/IO =    393.2 Mbytes/s
        2048 kbytes:   4896.4 usec/IO =    408.5 Mbytes/s
        4096 kbytes:   9583.3 usec/IO =    417.4 Mbytes/s
        8192 kbytes:  19007.7 usec/IO =    420.9 Mbytes/s
Here's some raw dd read and writes (compression turned off, of course). Sync is set to "always" for the dataset:
Code:
root@freenas[/mnt/flashpool]# dd if=/dev/zero of=testfile bs=1M count=20000
20000+0 records in
20000+0 records out
20971520000 bytes transferred in 14.681608 secs (1428421222 bytes/sec)
and here are the write speeds (these are mirrored vdevs):
Code:
root@freenas[/mnt/flashpool]# dd if=testfile of=/dev/null bs=1M count=20000
20000+0 records in
20000+0 records out
20971520000 bytes transferred in 4.770633 secs (4395961619 bytes/sec)
And here's performance on Windows 10 VM (8 vCPUs, 8GB RAM) using this as an iSCSI target over a 10Gb link (single):

The top and bottom tests seem correct. The top one is just maxing out the 10Gb link on a sequential read/write. The bottom seems more or less consistent with the single drive performance on 4k random i/o shown above with diskinfo.
Less sure about the middle two tests, especially the 8Q/8T one. I played with different thread and queue counts to see if I could push the speed higher but I seem to be maxed out on the 8T/8Q test--that comes out to roughly 100k IOPS. These drives - Samsung 883 DCT -- are spec'd at 98k IOPS read/28k IOPs write. I'm running 2 wide mirror/4 devs so I think that explain my writes maxing out at around 100k IOPs (~28k x 4). Not sure why I can't get higher reads.
Also, I tried the same test on an NFS share on the same array (dataset has sync set as Always as well). Interestingly, the write speeds dropped off. Not sure why:

Last edited:

