"nonsense" disk activity while getting folder properties

Status
Not open for further replies.

jasonbuechler

Dabbler
Joined
Mar 28, 2018
Messages
20
So I think I have two separate issues -- the one I'm less interested in is, I'm guessing, a failing 2GB Green disk. I have done zero work looking into that issue, since it's not super concerning to me and I'll replace it this week.

The bigger issue is what the title says: when I try to pull up the properties window for a group of folders on my RaidZ2 nas, I get inexplicably performance-crushing (i'm guessing) i/o activity.
I don't have a clue where to start trying to figure out what's going on here! :'(
I'd be very thankful for everyone's suggestions/explanations, here!!!
Here's some basic info:
  1. dataset with windows acls, no compression, no dedupe, nothing fancy at all
  2. it takes FOREVER to iterate through the files summing the file sizes
    • several minutes for 25000 files (150gb)
    • via a windows 10 machine
    • reliable 116+ MBps writes across the lan
    • nas benchmarks: iperf ~950mbps, & iozone write/read ~160/195MBps (for very large files)
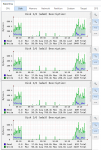
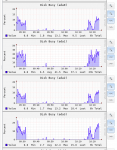
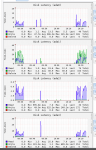
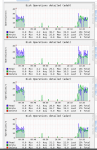
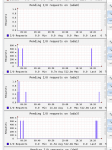
  3. but much more inexplicably, when I look at the webconsole reporting, there's constant *write* activity across all disks -- FAR more than read activity
    • Disk i/o for all members ~375/75 kBps for WRITE/read (what??!!!?)
    • Disk-busy ~10% for 3 of the disks, and 30% for the disk that I suspect is dying
    • read-latency for "that one disk" about the same as the others, but same iffy disk has write-latency north of 20% when the others have 0%-ish
    • I'll include screenshots from the Reporting page


Code:
fox@nas:/mnt/nas/win % zpool status
  pool: freenas-boot
 state: ONLINE
  scan: none requested
config:

		NAME		STATE	 READ WRITE CKSUM
		freenas-boot  ONLINE	   0	 0	 0
		  da0p2	 ONLINE	   0	 0	 0

errors: No known data errors

  pool: nas
 state: ONLINE
  scan: none requested
config:

		NAME											STATE	 READ WRITE CKSUM
		nas											 ONLINE	   0	 0	 0
		  raidz2-0									  ONLINE	   0	 0	 0
			gptid/be7a6215-3070-11e8-8526-d89ef30c93f5  ONLINE	   0	 0	 0
			gptid/bf562aac-3070-11e8-8526-d89ef30c93f5  ONLINE	   0	 0	 0
			gptid/c07b6ea8-3070-11e8-8526-d89ef30c93f5  ONLINE	   0	 0	 0
			gptid/c18b642d-3070-11e8-8526-d89ef30c93f5  ONLINE	   0	 0	 0

errors: No known data errors

fox@nas:/mnt/nas/win % zfs list
NAME												   USED  AVAIL  REFER  MOUNTPOINT
freenas-boot										   849M  55.4G	64K  none
freenas-boot/ROOT									  841M  55.4G	29K  none
freenas-boot/ROOT/Initial-Install						1K  55.4G   835M  legacy
freenas-boot/ROOT/default							  841M  55.4G   839M  legacy
freenas-boot/grub									 6.97M  55.4G  6.97M  legacy
nas												   2.51T   912G   128K  /mnt/nas
nas/.system										   4.56M   912G   140K  legacy
nas/.system/configs-b3147af497d748f98f845f65b942be53  3.16M   912G  3.16M  legacy
nas/.system/cores									  128K   912G   128K  legacy
nas/.system/rrd-b3147af497d748f98f845f65b942be53	   128K   912G   128K  legacy
nas/.system/samba4									 918K   912G   918K  legacy
nas/.system/syslog-b3147af497d748f98f845f65b942be53	128K   912G   128K  legacy
nas/htpc											  1.30T   912G  1.30T  /mnt/nas/htpc
nas/jails											  128K   912G   128K  /mnt/nas/jails
nas/photos											48.2G   912G  48.2G  /mnt/nas/photos
nas/win											   1.16T   912G  1.16T  /mnt/nas/win
fox@nas:/mnt/nas/win % zpool list
NAME		   SIZE  ALLOC   FREE  EXPANDSZ   FRAG	CAP  DEDUP  HEALTH  ALTROOT
freenas-boot	58G   849M  57.2G		 -	  -	 1%  1.00x  ONLINE  -
nas		   7.25T  5.19T  2.06T		 -	 1%	71%  1.00x  ONLINE  /mnt


Attachments

  • 2018-03-28 10_25_51-nas - FreeNAS-11.1-U4 (89e3d93bc).png
    2018-03-28 10_25_51-nas - FreeNAS-11.1-U4 (89e3d93bc).png
    71.4 KB · Views: 308
  • 2018-03-28 10_26_06-nas - FreeNAS-11.1-U4 (89e3d93bc).png
    2018-03-28 10_26_06-nas - FreeNAS-11.1-U4 (89e3d93bc).png
    57.6 KB · Views: 305
  • 2018-03-28 10_26_22-nas - FreeNAS-11.1-U4 (89e3d93bc).png
    2018-03-28 10_26_22-nas - FreeNAS-11.1-U4 (89e3d93bc).png
    62.9 KB · Views: 353
  • 2018-03-28 10_26_35-nas - FreeNAS-11.1-U4 (89e3d93bc).png
    2018-03-28 10_26_35-nas - FreeNAS-11.1-U4 (89e3d93bc).png
    66.5 KB · Views: 303
  • 2018-03-28 10_26_48-nas - FreeNAS-11.1-U4 (89e3d93bc).png
    2018-03-28 10_26_48-nas - FreeNAS-11.1-U4 (89e3d93bc).png
    51.5 KB · Views: 296

Chris Moore

Hall of Famer
Joined
May 2, 2015
Messages
10,080
Your .system folder is on the storage pool and that is going to have pretty much constant activity.

You could give us a rundown on the hardware and settings. That might help figure out the problem.
It is probably an incorrect setting in the SMB share that is causing the extra activity.
You have 5TB of data on the pool (71% filled) and have never done a scrub on it?
How long has this system been running?
What version of FreeNAS is it?
Information is key to solutions.
 

wblock

Documentation Engineer
Joined
Nov 14, 2014
Messages
1,506
same iffy disk has write-latency north of 20% when the others have 0%-ish
On a failing disk, this does not seem surprising. Write fails, non-NAS disk does not have TLER and does many slow retries before finally giving up and using a spare block.
 

Chris Moore

Hall of Famer
Joined
May 2, 2015
Messages
10,080
the one I'm less interested in is, I'm guessing, a failing 2GB Green disk.
I agree with wblock, you should replace that failing disk before you worry about anything else, it could be dragging the whole pool down.
 

jasonbuechler

Dabbler
Joined
Mar 28, 2018
Messages
20
Right here at the top, lemme thank you guys for assisting me on such an open-ended PITA!
And my apologies for the verbosity below... I might as well over-inform than under-inform, I guess.
I have also attached a debug and several screenshots re: the smb-share and volume.

On a failing disk, this does not seem surprising. Write fails, non-NAS disk does not have TLER and does many slow retries before finally giving up and using a spare block.

Ah that makes sense, thank you.
Can you recommend some diagnostics to run/check/whatever, so help turn the assumption into something more tangible?
I flirted with the idea of enabling the SMART service, but then got stymied by the available options and a couple (admittedly brief) searches didn't turn up any official-sounding recommendations so I put it on my "deal with it later" pile. I wouldn't mind recommendation here, either :D (a link to someone else asking this same question is fine -- I just didn't want to try and evaluate what (briefly) appeared to be wide-ranging opinion.
Regardless, I have another drive I can swap in, so I'll do that tonight.


Your .system folder is on the storage pool and that is going to have pretty much constant activity.

You could give us a rundown on the hardware and settings. That might help figure out the problem.
It is probably an incorrect setting in the SMB share that is causing the extra activity.
You have 5TB of data on the pool (71% filled) and have never done a scrub on it?
How long has this system been running?
What version of FreeNAS is it?
Information is key to solutions.

My idiotic bad not even providing the version of FreeNAS! D'oh! I tried to be so thorough!....
  • Dell PowerEdge T30
  • Just stood up a few days ago and (again admittedly, I don't know how often I should scrub/schedule scrubbing)
  • 2x 2GB WD Green disks that might literally be pushing 10 years old
  • 2x 3GB HGST "refurb" server pulls (https://www.newegg.com/Product/Product.aspx?Item=1Z4-001J-00224 ... I know, I know! I don't need a lecture on avoiding shitty drives while simultaneously not being well-informed on health-reporting ;) it's mostly an HTPC box, with a backup)
  • Build= FreeNAS-11.1-U4
  • Platform= Intel(R) Xeon(R) CPU E3-1225 v5 @ 3.30GHz
  • Memory= 8021MB (non-ECC, for now. will upgrade asap.)
  • System Time= Thu, 29 Mar 2018 08:19:30 -0700
  • Uptime= 8:19AM up 3 days, 18:38, 0 users
  • Load Average= 0.04, 0.10, 0.11
I put the system dataset on the main pool since I read (...somewhere... hopefully the docs) that due to excessive write activity, it shouldn't be on a thumb drive, which is the only other disk in the box. This box only has 4x sata ports, but has an undocumented m2 slot on the motherboard -- should I look into buying a disk to use that or is it not a huge deal?

Code:
root@nas:/mnt/nas/win # getfacl ./
# file: ./
# owner: fox
# group: thefoxes
			group@:rwxpDdaARWcCo-:fd-----:allow
			owner@:rwxpDdaARWcCo-:fd-----:allow
root@nas:/mnt/nas/win #
root@nas:/mnt/nas/win # cat /usr/local/etc/smb4.conf
[global]
	encrypt passwords = yes
	dns proxy = no
	strict locking = no
	oplocks = yes
	deadtime = 15
	max log size = 51200
	max open files = 231005
	logging = file
	load printers = no
	printing = bsd
	printcap name = /dev/null
	disable spoolss = yes
	getwd cache = yes
	guest account = nobody
	map to guest = Bad User
	obey pam restrictions = yes
	ntlm auth = no
	directory name cache size = 0
	kernel change notify = no
	panic action = /usr/local/libexec/samba/samba-backtrace
	nsupdate command = /usr/local/bin/samba-nsupdate -g
	server string = FreeNAS Server
	ea support = yes
	store dos attributes = yes
	lm announce = yes
	hostname lookups = yes
	time server = yes
	acl allow execute always = true
	dos filemode = yes
	multicast dns register = yes
	domain logons = no
	local master = yes
	idmap config *: backend = tdb
	idmap config *: range = 90000001-100000000
	server role = standalone
	netbios name = NAS
	workgroup = WORKGROUP
	security = user
	create mask = 0666
	directory mask = 0777
	client ntlmv2 auth = yes
	dos charset = CP437
	unix charset = UTF-8
	log level = 1


[gen]
	path = "/mnt/nas/win"
	comment = General storage for windows
	printable = no
	veto files = /.snapshot/.windows/.mac/.zfs/
	writeable = yes
	browseable = yes
	access based share enum = no
	vfs objects = zfs_space zfsacl streams_xattr
	hide dot files = yes
	guest ok = no
	nfs4:mode = special
	nfs4:acedup = merge
	nfs4:chown = true
	zfsacl:acesort = dontcare


[htpc]
	path = "/mnt/nas/htpc"
	printable = no
	veto files = /.snapshot/.windows/.mac/.zfs/
	writeable = yes
	browseable = yes
	access based share enum = no
	vfs objects = zfs_space zfsacl streams_xattr
	hide dot files = yes
	guest ok = yes
	nfs4:mode = special
	nfs4:acedup = merge
	nfs4:chown = true
	zfsacl:acesort = dontcare


[movies]
	path = "/mnt/nas/htpc/movies"
	printable = no
	veto files = /.snapshot/.windows/.mac/.zfs/
	writeable = yes
	browseable = yes
	access based share enum = no
	vfs objects = zfs_space zfsacl streams_xattr
	hide dot files = yes
	guest ok = yes
	nfs4:mode = special
	nfs4:acedup = merge
	nfs4:chown = true
	zfsacl:acesort = dontcare


[photos]
	path = "/mnt/nas/photos"
	printable = no
	veto files = /.snapshot/.windows/.mac/.zfs/
	writeable = yes
	browseable = yes
	access based share enum = no
	vfs objects = zfs_space zfsacl streams_xattr
	hide dot files = yes
	guest ok = no
	nfs4:mode = special
	nfs4:acedup = merge
	nfs4:chown = true
	zfsacl:acesort = dontcare


[tv]
	path = "/mnt/nas/htpc/tv"
	printable = no
	veto files = /.snapshot/.windows/.mac/.zfs/
	writeable = yes
	browseable = yes
	access based share enum = no
	vfs objects = zfs_space zfsacl streams_xattr
	hide dot files = yes
	guest ok = yes
	nfs4:mode = special
	nfs4:acedup = merge
	nfs4:chown = true
	zfsacl:acesort = dontcare
root@nas:/mnt/nas/win #


2018-03-29 09_35_55-ucc000.ucc.nau.edu - Chrome Remote Desktop.png 2018-03-29 09_36_42-ucc000.ucc.nau.edu - Chrome Remote Desktop.png 2018-03-29 09_37_08-ucc000.ucc.nau.edu - Chrome Remote Desktop.png 2018-03-29 09_39_10-OchoGrande - Chrome Remote Desktop.png
 

Attachments

  • debug-nas-20180329094851.tgz
    265.6 KB · Views: 241

wblock

Documentation Engineer
Joined
Nov 14, 2014
Messages
1,506
Get the SMART statistics from the drive and post them here. Run a SMART short test on it. If it passes that, then run a long test.

Assuming ada3 is the suspected bad drive:
smartctl -a /dev/ada3 (post those here)


And then, if needed:
smartctl -tshort /dev/ada3
smartctl -tlong /dev/ada3
 

Chris Moore

Hall of Famer
Joined
May 2, 2015
Messages
10,080
I flirted with the idea of enabling the SMART service
Yes, do that. And schedule periodic tests. Here is the reference on how:
http://doc.freenas.org/11/tasks.html#s-m-a-r-t-tests
I do a SMART short test every day and a long test once a week. Just figure a time that is not when you will be using the system and the long test takes more time depending on the drive size and other disk activity, so figure 4 to 6 hours or more for that to run.
I put the system dataset on the main pool since I read (...somewhere... hopefully the docs) that due to excessive write activity, it shouldn't be on a thumb drive,
It is correct about the USB stick drives. The activity of the system dataset would burn one of them out in no time. It isn't a problem having it on the main pool, but it could be a source of the activity.
 

Chris Moore

Hall of Famer
Joined
May 2, 2015
Messages
10,080
Question, why did you disable compression? It actually improves performance?

It can also improve performance to disable atime on the same page as the compression.
 

jasonbuechler

Dabbler
Joined
Mar 28, 2018
Messages
20
I do a SMART short test every day and a long test once a week. Just figure a time that is not when you will be using the system and the long test takes more time depending on the drive size and other disk activity, so figure 4 to 6 hours or more for that to run.
Concrete numbers, woohoo! Thank you!


Get the SMART statistics from the drive and post them here. Run a SMART short test on it. If it passes that, then run a long test.

Assuming ada3 is the suspected bad drive:
smartctl -a /dev/ada3 (post those here)

And then, if needed:
smartctl -tshort /dev/ada3
smartctl -tlong /dev/ada3


If I'm interpreting the Reporting charts correctly, it's ada1 that seems iffy (though I'll now be short-testing all of them...).

I shared-up a folder with the output stats and shorttests from all of the 4 disks, just in case they help clear something up: https://drive.google.com/open?id=1IkY5X1lt9AZP-8ql_T0knrmigDopf302

Here's the stats from just ada1:
Code:
root@nas:/mnt/nas/win # smartctl -a /dev/ada1
smartctl 6.6 2017-11-05 r4594 [FreeBSD 11.1-STABLE amd64] (local build)
Copyright (C) 2002-17, Bruce Allen, Christian Franke, www.smartmontools.org

=== START OF INFORMATION SECTION ===
Model Family:	 Western Digital AV-GP (AF)
Device Model:	 WDC WD20EURS-63S48Y0
Serial Number:	WD-WMAZA8271102
LU WWN Device Id: 5 0014ee 2b1849a83
Firmware Version: 51.0AB51
User Capacity:	2,000,398,934,016 bytes [2.00 TB]
Sector Sizes:	 512 bytes logical, 4096 bytes physical
Device is:		In smartctl database [for details use: -P show]
ATA Version is:   ATA8-ACS (minor revision not indicated)
SATA Version is:  SATA 2.6, 3.0 Gb/s
Local Time is:	Thu Mar 29 11:47:48 2018 PDT
SMART support is: Available - device has SMART capability.
SMART support is: Enabled

=== START OF READ SMART DATA SECTION ===
SMART overall-health self-assessment test result: PASSED

General SMART Values:
Offline data collection status:  (0x00) Offline data collection activity
										was never started.
										Auto Offline Data Collection: Disabled.
Self-test execution status:	  (   0) The previous self-test routine completed
										without error or no self-test has ever
										been run.
Total time to complete Offline
data collection:				(39480) seconds.
Offline data collection
capabilities:					(0x7b) SMART execute Offline immediate.
										Auto Offline data collection on/off support.
										Suspend Offline collection upon new
										command.
										Offline surface scan supported.
										Self-test supported.
										Conveyance Self-test supported.
										Selective Self-test supported.
SMART capabilities:			(0x0003) Saves SMART data before entering
										power-saving mode.
										Supports SMART auto save timer.
Error logging capability:		(0x01) Error logging supported.
										General Purpose Logging supported.
Short self-test routine
recommended polling time:		(   2) minutes.
Extended self-test routine
recommended polling time:		( 380) minutes.
Conveyance self-test routine
recommended polling time:		(   5) minutes.
SCT capabilities:			  (0x3035) SCT Status supported.
										SCT Feature Control supported.
										SCT Data Table supported.

SMART Attributes Data Structure revision number: 16
Vendor Specific SMART Attributes with Thresholds:
ID# ATTRIBUTE_NAME		  FLAG	 VALUE WORST THRESH TYPE	  UPDATED  WHEN_FAILED RAW_VALUE
  1 Raw_Read_Error_Rate	 0x002f   200   200   051	Pre-fail  Always	   -	   0
  3 Spin_Up_Time			0x0027   183   166   021	Pre-fail  Always	   -	   5816
  4 Start_Stop_Count		0x0032   098   098   000	Old_age   Always	   -	   2154
  5 Reallocated_Sector_Ct   0x0033   200   200   140	Pre-fail  Always	   -	   0
  7 Seek_Error_Rate		 0x002e   200   200   000	Old_age   Always	   -	   0
  9 Power_On_Hours		  0x0032   096   096   000	Old_age   Always	   -	   3567
 10 Spin_Retry_Count		0x0032   100   100   000	Old_age   Always	   -	   0
 11 Calibration_Retry_Count 0x0032   100   100   000	Old_age   Always	   -	   0
 12 Power_Cycle_Count	   0x0032   100   100   000	Old_age   Always	   -	   291
192 Power-Off_Retract_Count 0x0032   200   200   000	Old_age   Always	   -	   178
193 Load_Cycle_Count		0x0032   200   200   000	Old_age   Always	   -	   1975
194 Temperature_Celsius	 0x0022   118   090   000	Old_age   Always	   -	   32
196 Reallocated_Event_Count 0x0032   200   200   000	Old_age   Always	   -	   0
197 Current_Pending_Sector  0x0032   200   200   000	Old_age   Always	   -	   0
198 Offline_Uncorrectable   0x0030   100   253   000	Old_age   Offline	  -	   0
199 UDMA_CRC_Error_Count	0x0032   200   200   000	Old_age   Always	   -	   0
200 Multi_Zone_Error_Rate   0x0008   100   253   000	Old_age   Offline	  -	   0

SMART Error Log Version: 1
No Errors Logged

SMART Self-test log structure revision number 1
Num  Test_Description	Status				  Remaining  LifeTime(hours)  LBA_of_first_error
# 1  Short offline	   Aborted by host			   90%	  1856		 -

SMART Selective self-test log data structure revision number 1
 SPAN  MIN_LBA  MAX_LBA  CURRENT_TEST_STATUS
	1		0		0  Not_testing
	2		0		0  Not_testing
	3		0		0  Not_testing
	4		0		0  Not_testing
	5		0		0  Not_testing
Selective self-test flags (0x0):
  After scanning selected spans, do NOT read-scan remainder of disk.
If Selective self-test is pending on power-up, resume after 0 minute delay.

root@nas:/mnt/nas/win # smartctl -a /dev/ada1 > smartctl1.txt


I'm happy but confused to report that the short-test completed without error for ada1. ...as did the other disks. So needless to say I'll be running the long test on them starting with ada1.

Brief aside though to slake my curiosity:
I know theories are best held until I replace that one disk (if for no other reason than because I can, and I'll be able to see if the problem persists at position ada1)... but regarding the fact there is ANY write activity (let alone seemingly heavy write activity) while getting properties on a large folder -- that's weird, right?? The graphs I attached to my original post were captured with *no copy/write activity*, while simply getting properties on that large folder. Sooo... are there any circumstances under which that might be considered understandable??? (Aside from somehow a write-action happening without my awareness. Cough.)

Thanks again!!!
I very much appreciate your help & time!
 

Chris Moore

Hall of Famer
Joined
May 2, 2015
Messages
10,080
I'm happy but confused to report that the short-test completed without error for ada1. ...as did the other disks. So needless to say I'll be running the long test on them starting with ada1.
You can run them all at once. They run internally to the drive. Each drive should tell you how long it will take to finish the test.
 

Chris Moore

Hall of Famer
Joined
May 2, 2015
Messages
10,080
but regarding the fact there is ANY write activity (let alone seemingly heavy write activity) while getting properties on a large folder -- that's weird, right??
The atime feature may be at fault for that. It updated the time the file was accessed last every time the file is accessed. If you disable that, it might make everything faster.
 

jasonbuechler

Dabbler
Joined
Mar 28, 2018
Messages
20
The atime feature may be at fault for that. It updated the time the file was accessed last every time the file is accessed. If you disable that, it might make everything faster.
Question, why did you disable compression? It actually improves performance?
It can also improve performance to disable atime on the same page as the compression.

Oh well that's an easy answer!! ...I'm naive and ignorant of the finer details! :D :'(
Since the vast majority of the bytes on the drive were going to be video files, I didn't think I'd be able to see any savings, and also believed there would be at least a LITTLE cost to compression which, since I theorized no savings, I might as well disable.

So even in this case, I should re-enable compression?

And I literally had not looked up what atime is, until this moment, and yeah, that sounds plenty probable! I'm a little confused why _access_ time would be updated when just pulling file sizes, but I have no need to question it, either! It's something I'll definitely try after swapping disks.

You can run them all at once. They run internally to the drive. Each drive should tell you how long it will take to finish the test.

Ah, I was hoping that was the case, but didn't want to chance complicating things. Thanks!!

Edit: I'm confused why 2 of the drives (the server pulls, I think) are forecasting the extended test to only take 2 minutes??? -->
Code:
root@nas:/mnt/nas/win # smartctl -tlong /dev/ada0
smartctl 6.6 2017-11-05 r4594 [FreeBSD 11.1-STABLE amd64] (local build)
Copyright (C) 2002-17, Bruce Allen, Christian Franke, www.smartmontools.org

=== START OF OFFLINE IMMEDIATE AND SELF-TEST SECTION ===
Sending command: "Execute SMART Extended self-test routine immediately in off-line mode".
Drive command "Execute SMART Extended self-test routine immediately in off-line mode" successful.
Testing has begun.
Please wait 1 minutes for test to complete.
Test will complete after Thu Mar 29 13:09:18 2018

root@nas:/mnt/nas/win # smartctl -tlong /dev/ada1
=== START OF OFFLINE IMMEDIATE AND SELF-TEST SECTION ===
Sending command: "Execute SMART Extended self-test routine immediately in off-line mode".
Drive command "Execute SMART Extended self-test routine immediately in off-line mode" successful.
Testing has begun.
Please wait 380 minutes for test to complete.
Test will complete after Thu Mar 29 19:28:50 2018

root@nas:/mnt/nas/win # smartctl -tlong /dev/ada2
=== START OF OFFLINE IMMEDIATE AND SELF-TEST SECTION ===
Sending command: "Execute SMART Extended self-test routine immediately in off-line mode".
Drive command "Execute SMART Extended self-test routine immediately in off-line mode" successful.
Testing has begun.
Please wait 1 minutes for test to complete.
Test will complete after Thu Mar 29 13:10:28 2018

root@nas:/mnt/nas/win # smartctl -tlong /dev/ada3
=== START OF OFFLINE IMMEDIATE AND SELF-TEST SECTION ===
Sending command: "Execute SMART Extended self-test routine immediately in off-line mode".
Drive command "Execute SMART Extended self-test routine immediately in off-line mode" successful.
Testing has begun.
Please wait 347 minutes for test to complete.
Test will complete after Thu Mar 29 18:56:33 2018
(I trimmed the output slightly for readability)

Also - I thought of one other thing while thinking about the possibility that the share is to blame: case sensitivity. It's the only default besides compression that I changed when I set up my volumes. Again, there seemed to be competing opinions about "just keep the defaults!" but the one that seemed the most well-referenced said to use "mixed" when in a mixed environment. I just figured I'd throw that in here too, in case I'm guilty of being a dummy.
 
Last edited:

Chris Moore

Hall of Famer
Joined
May 2, 2015
Messages
10,080
So even in this case, I should re-enable compression?
I think it would be a good thing to turn it on, and LZ4 (which is default) is a good kind of compression to use.
Because of the way compression works within the ZFS data flow, it is beneficial in almost all cases and when it isn't, there isn't a lot of overhead because the CPU handles the compression / decompression and the CPU is much faster than the drives. Unfortunately, any data already written is written without compression, but it might benefit future data that is added. Also, if you copy a file to another directory, the copy will be compressed because it represents a new write to the drive. You could then delete the file from the original location.
Edit: I'm confused why 2 of the drives (the server pulls, I think) are forecasting the extended test to only take 2 minutes???
That is not possible. There must be some setting in the drive that is preventing it from doing an actual test. What kind of drive is it?
Also - I thought of one other thing while thinking about the possibility that the share is to blame: case sensitivity. It's the only default besides compression that I changed when I set up my volumes. Again, there seemed to be competing opinions about "just keep the defaults!" but the one that seemed the most well-referenced said to use "mixed" when in a mixed environment. I just figured I'd throw that in here too, in case I'm guilty of being a dummy.
Turning off case sensitivity is a thing that is often suggested to make a share faster.
 

jasonbuechler

Dabbler
Joined
Mar 28, 2018
Messages
20
  1. I think it would be a good thing to turn it on, and LZ4 (which is default) is a good kind of compression to use. [...snip...]
  2. That is not possible. There must be some setting in the drive that is preventing it from doing an actual test. What kind of drive is it?
  3. Turning off case sensitivity is a thing that is often suggested to make a share faster.

  1. well then, consider it re-enabled! thank you muchly for the authoritative reference :) I'm brand-new to this and need all the authority I can gather
  2. You are correct, see the "smartctl-capabilities-all-40pct.txt" file I added to that google drive folder, above. All drives are still running tests and have 40% remaining. There must be a model-specific glitch in smartctl's invocation verification...!...? Those 2 disks are the "refurb" Ultrastar 7k4000's from newegg, linked above, that were on sale for something like $30 a pop a while back, so I couldn't say no, knowing I was going to be setting up a Z2 pool. I'll include their smartctl -c dumps, below.
  3. I'll keep that in mind for the future, but I'm quite happy (outside that Properties... issue.) with my share speeds for now. I thought I recalled reading that case-sensitivity was immutable on a dataset, once created. If that's not correct, can anyone point me to how one might do it?

Code:
Model Family:	 Hitachi/HGST Ultrastar 7K4000
Device Model:	 Hitachi HUS724030ALE641
Serial Number:	P8HD89PR
LU WWN Device Id: 5 000cca 22cd3ab29
Firmware Version: MJ8OA5F0
User Capacity:	3,000,592,982,016 bytes [3.00 TB]
Sector Sizes:	 512 bytes logical, 4096 bytes physical
Rotation Rate:	7200 rpm
Form Factor:	  3.5 inches
Device is:		In smartctl database [for details use: -P show]
ATA Version is:   ATA8-ACS T13/1699-D revision 4
SATA Version is:  SATA 3.0, 6.0 Gb/s (current: 6.0 Gb/s)
Local Time is:	Thu Mar 29 12:08:28 2018 PDT
SMART support is: Available - device has SMART capability.
SMART support is: Enabled


Model Family:	 Hitachi/HGST Ultrastar 7K4000
Device Model:	 Hitachi HUS724030ALE641
Serial Number:	P8H67SAR
LU WWN Device Id: 5 000cca 22cd0eed5
Firmware Version: MJ8OA5F0
User Capacity:	3,000,592,982,016 bytes [3.00 TB]
Sector Sizes:	 512 bytes logical, 4096 bytes physical
Rotation Rate:	7200 rpm
Form Factor:	  3.5 inches
Device is:		In smartctl database [for details use: -P show]
ATA Version is:   ATA8-ACS T13/1699-D revision 4
SATA Version is:  SATA 3.0, 6.0 Gb/s (current: 6.0 Gb/s)
Local Time is:	Thu Mar 29 12:06:36 2018 PDT
SMART support is: Available - device has SMART capability.
SMART support is: Enabled


Thanks again, all.
I'll update later with any interesting extended-test results.

Jason
 

jasonbuechler

Dabbler
Joined
Mar 28, 2018
Messages
20
Well, that's a head scratcher -- every extended test came up completed-without-error. (!!)
I don't know much about unusual disk behavior, but grasping at straws, is it possible that the unusual latency for one disk could be due to just that one disk being too hot?

I've got an infrared thermometer, so could test the theory -- is there a favored stress-test or stressing procedure to hit it/the pool with?


Code:
root@nas:/mnt/nas/win # smartctl -l selftest /dev/ada0
smartctl 6.6 2017-11-05 r4594 [FreeBSD 11.1-STABLE amd64] (local build)
Copyright (C) 2002-17, Bruce Allen, Christian Franke, www.smartmontools.org

=== START OF READ SMART DATA SECTION ===
SMART Self-test log structure revision number 1
Num  Test_Description	Status				  Remaining  LifeTime(hours)  LBA_of_first_error
# 1  Extended offline	Completed without error	   00%	 21082		 -
# 2  Short offline	   Completed without error	   00%	 21074		 -
# 3  Short captive	   Completed without error	   00%	 19415		 -
# 4  Vendor (0xb0)	   Completed without error	   00%	 19127		 -
# 5  Vendor (0x71)	   Completed without error	   00%	 19127		 -

root@nas:/mnt/nas/win # smartctl -l selftest /dev/ada1
smartctl 6.6 2017-11-05 r4594 [FreeBSD 11.1-STABLE amd64] (local build)
Copyright (C) 2002-17, Bruce Allen, Christian Franke, www.smartmontools.org

=== START OF READ SMART DATA SECTION ===
SMART Self-test log structure revision number 1
Num  Test_Description	Status				  Remaining  LifeTime(hours)  LBA_of_first_error
# 1  Extended offline	Completed without error	   00%	  3575		 -
# 2  Short offline	   Completed without error	   00%	  3567		 -
# 3  Short offline	   Completed without error	   00%	  3567		 -
# 4  Short offline	   Aborted by host			   90%	  1856		 -

root@nas:/mnt/nas/win # smartctl -l selftest /dev/ada2
smartctl 6.6 2017-11-05 r4594 [FreeBSD 11.1-STABLE amd64] (local build)
Copyright (C) 2002-17, Bruce Allen, Christian Franke, www.smartmontools.org

=== START OF READ SMART DATA SECTION ===
SMART Self-test log structure revision number 1
Num  Test_Description	Status				  Remaining  LifeTime(hours)  LBA_of_first_error
# 1  Extended offline	Completed without error	   00%	 22028		 -
# 2  Short offline	   Completed without error	   00%	 22020		 -
# 3  Short offline	   Completed without error	   00%	 20413		 -
# 4  Short captive	   Completed without error	   00%	 20332		 -
# 5  Vendor (0xb0)	   Completed without error	   00%	 20232		 -
# 6  Vendor (0x71)	   Completed without error	   00%	 20232		 -

root@nas:/mnt/nas/win # smartctl -l selftest /dev/ada3
smartctl 6.6 2017-11-05 r4594 [FreeBSD 11.1-STABLE amd64] (local build)
Copyright (C) 2002-17, Bruce Allen, Christian Franke, www.smartmontools.org

=== START OF READ SMART DATA SECTION ===
SMART Self-test log structure revision number 1
Num  Test_Description	Status				  Remaining  LifeTime(hours)  LBA_of_first_error
# 1  Extended offline	Completed without error	   00%	  7882		 -
# 2  Short offline	   Completed without error	   00%	  7876		 -
 

Bidule0hm

Server Electronics Sorcerer
Joined
Aug 5, 2013
Messages
3,710
It can be but you need pretty high temps to see immediate problems, something like 50 °C+

No need for a thermometer, SMART is reporting the temp, use the command smartctl -A /dev/your_device it's the attribute 194 Temperature_Celsius
 

jasonbuechler

Dabbler
Joined
Mar 28, 2018
Messages
20
Sorry to necro this old thread, but I wanted to leave some updates for anyone landing here in the future with similar symptoms: everything is all better now :D

I cannot say for certain what the fix is, unfortunately, but I can tell you the changes I've made:

- I got a sata controller card so i could use more ports
- I added two Red HDDs to the box (6 total HDDs)
- I destroyed my old 4-disk pool and created a new 5-disk pool
--- First, I backed up (replicated) a snapshot (twice) to two external, USB-connected, HDDs
--- I replicated a snapshot from one of the backup HDDs back to the new pool
--- I replaced that suspect 2GB Green (storage->pools->pool status->[device menu]->Replace) with a new 4TB Red
- For all my non-implicit datasets, I applied options:
--- set the "Share Type" option to be Unix instead of Windows
--- disabled atime
--- and left Case Sensitivity as Mixed
- For all my non-implicit datasets, I aggressively applied permissions, recursively:
--- ACL Type: Unix
--- Apply User, Apply Group, Apply Mode: 755

I actually had quite a bit of difficulty getting permissions to stick for one, and only one, of my datasets. I ultimately had to resort to recursively applying those permissions to the implicit/root dataset before I saw them stick to that weird one. Kinda wondering if there might have been some weird windows ACLs somehow breaking things?

Why did I leave case sensitive mixed? Because I forgot :( ... and it still seems to be an immutable property. Can anyone verify that or tell me how to change it?
Why did I give up on Windows share-type and ACLs? Well number 1, because I *still* don't understand the subtle differences between the settings for share-type and ACL-type for windows, and I'm more comfortable with unix anyway. But also because I read in some other long-forgotten/lost forum post that there might be scenarios where Windows tries to do a butt-ton of background stuff with heavily nested/populated filesystems that bogs it down, so I figured it was worth trying. I don't know if that had anything to do with it... maybe it was just getting rid of that Green, but who knows.

I'd also still love someone to explain the diff between the share-type/ACL-type option/permissions... I've tried to carefully read a half dozen explanations on here and I'm still fuzzy at best.
 
Status
Not open for further replies.
Top