Memory leak sucking up all ram?

thirdgen89gta

Dabbler
Joined
May 5, 2014
Messages
32
I know that FreeNAS is built to use all available memory, so I'm not concerned that every bit of it is in use by something. What I'm running into though seems to be that the ARC size starts out large, and then as time goes on during the month, the ARC size shrinks, while the Services memory usage grows to what seems like an unreasonable amount.

Performance wise the NAS is fine. Plex is responsive, file transfers no matter which protocol are near maximum line rates (1GigE), no issues with stability. No usual error messages in the logs from a crashing service.

Seem to be having an issue with FreeNAS where after a reboot it starts off good and ARC fills up to about 18-23GB. Then over time the services category seem to suck up more and more ram, leaving less available for ARC. Eventually I end up with something like below where out of 32GB, only about 7GB is used for ARC, and the rest of it gets swallowed by the "Services" general category.
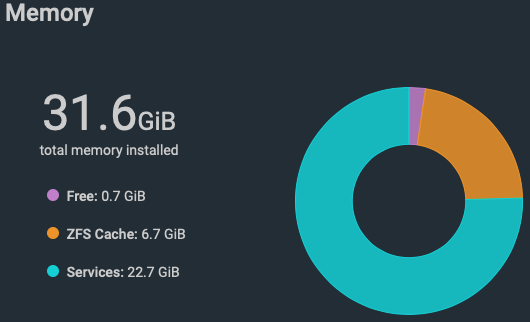
Screen Shot 2020-04-19 at 3.26.16 PM.png


Below, you can see the ZFS usage over time. Spikes after a reboot, holds for a few days, then drops like a stone and holds around 7GB ARC.

Screen Shot 2020-04-19 at 3.37.34 PM.png


Despite that, my ARC hit-rates remain high enough despite the drop in total ARC size. Consistently above 90%.

Screen Shot 2020-04-19 at 3.38.25 PM.png
 

Attachments

  • Screen Shot 2020-04-19 at 3.26.16 PM.png
    Screen Shot 2020-04-19 at 3.26.16 PM.png
    36.5 KB · Views: 302

thirdgen89gta

Dabbler
Joined
May 5, 2014
Messages
32
Which version of FreeNAS? IIRC, 11.3-U2 corrected a memory leak in the middleware.
Asgard% uname -a

FreeBSD Asgard.local 11.3-RELEASE-p6 FreeBSD 11.3-RELEASE-p6

NM, I see I'm on U1 (FreeNAS-11.3-U1) I'll have to upgrade and see over time if the same issue happens.
 

thirdgen89gta

Dabbler
Joined
May 5, 2014
Messages
32
already updated to U2 and rebooted, so won't show anything ATM since its a fresh boot. I'll have to wait till I observe the ARC memory fall and the Services category explode again.
 

thirdgen89gta

Dabbler
Joined
May 5, 2014
Messages
32
Do you have any jails, plugins, or VMs?
Checked the Plex Jail for memory usage, wasn't using anywhere near that much. About 8-10 PIDs using 80-100MB each. So maybe a gig of memory in use by the jail.


I looked at TOP before the reboot, no single process stood out with insane memory usage.
 

thirdgen89gta

Dabbler
Joined
May 5, 2014
Messages
32
What is output of top -b -o res?
Been a few days, ARC remained higher for about 2.5 days, after that, it dropped about 4GB. Services category is starting to grow again.
Screen Shot 2020-04-23 at 8.46.53 PM.png


Here's the output you asked for. Will give it another week and check back where the memory usage sits.
Code:
Asgard% top -b -o res
last pid:  4962;  load averages:  0.72,  0.52,  0.52  up 4+00:25:44    20:44:22
93 processes:  1 running, 92 sleeping

Mem: 384M Active, 13G Inact, 16G Wired, 886M Free
ARC: 13G Total, 5989M MFU, 6350M MRU, 12M Anon, 97M Header, 979M Other
     11G Compressed, 15G Uncompressed, 1.43:1 Ratio
Swap: 10G Total, 10G Free


  PID USERNAME    THR PRI NICE   SIZE    RES STATE   C   TIME    WCPU COMMAND
   79 root         42  20    0   383M   317M kqread  1  15:03   0.00% python3.7
 2702 plex         25  52    0   500M   311M uwait   2  36:24   0.00% Plex Media Server
 4227 plex         42  41   20   403M   196M nanslp  3  13:54  25.88% Plex Transcoder
 3366 plex         19  52    0   302M   183M uwait   6  17:18   0.00% Plex Media Server
 2693    892       29  20    0   220M   168M select  3   7:56   0.00% python2.7
 1435 root          1  20    0   162M   146M select  4   0:06   0.00% smbd
  138 root          4  20    0   200M   145M usem    5   1:08   0.00% python3.7
  139 root          4  20    0   185M   144M usem    7   1:07   0.00% python3.7
  141 root          4  20    0   179M   144M usem    2   1:07   0.00% python3.7
  137 root          4  20    0   177M   144M usem    4   1:10   0.00% python3.7
  140 root          4  20    0   175M   144M piperd  7   1:07   0.00% python3.7
 1623 root         15  20    0   177M   137M umtxn   7   0:02   0.00% uwsgi-3.7
 1551 root          1  20    0   128M   107M kqread  7   0:10   0.00% uwsgi-3.7
 2767 plex         13  52   15   148M   107M piperd  0   5:11   0.00% Plex Script Host
 1477 root          1  20    0   120M   104M select  6   0:00   0.00% smbd
 1473 root          1  20    0   120M   103M select  3   0:00   0.00% smbd
  526 root          4  20    0 78220K 64680K usem    5   0:22   0.00% python3.7
 1846 root          1  52    0 71392K 63568K ttyin   1   0:01   0.00% python3.7
 

thirdgen89gta

Dabbler
Joined
May 5, 2014
Messages
32
Do you have any jails, plugins, or VMs?
Just realized I didn't answer.

No VM's at all.
As far as Services go, I'm running:
  • AFP
  • NFS
  • SMB
  • SMART
  • UPS
  • SSH

I have two Plex jails built, both are built using the standard Plex jail. They are 11.3 release p8.
  • Jail 1 is a Plex jail used for personal family photo's and home movies. Its running the latest version of Plex available with portsnap. Its configured so its not accessible outside my LAN.
  • Jail 2 is also a Plex jail built on the standard jail, and using portsnap to install Plex. In addition to Plex it has Tautulli running for database info, also from Portsnap. This one is configured for my use outside my network. Movies, Music, TV Shows.
 

thirdgen89gta

Dabbler
Joined
May 5, 2014
Messages
32
Well its been a while and there were a few update. But as you can see the issue with Services sucking up more and more as time goes on has continued.

FreeNAS-11.3-U2.1
Uptime: 9:29PM up 22 days, 28 mins, 0 users

31.6GiB
total memory installed
Free: 0.6 GiB
ZFS Cache: 6.4 GiB
Services: 23.5 GiB

Code:
Asgard% top -b -o res
last pid: 59079;  load averages:  0.19,  0.19,  0.20  up 22+00:30:24    21:32:47
95 processes:  1 running, 94 sleeping

Mem: 238M Active, 23G Inact, 640M Laundry, 6595M Wired, 653M Free
ARC: 3814M Total, 1737M MFU, 1043M MRU, 9609K Anon, 52M Header, 974M Other
     1182M Compressed, 2368M Uncompressed, 2.00:1 Ratio
Swap: 10G Total, 10G Free


  PID USERNAME    THR PRI NICE   SIZE    RES STATE   C   TIME    WCPU COMMAND
   79 root         61  20    0   600M   516M kqread  5  97:05   0.00% python3.7
 2635 plex         19  52    0   575M   313M uwait   2 180:27   0.00% Plex Media Server
 2626    892       32  20    0   272M   187M select  7  44:16   0.00% python2.7
 3281 plex         20  52    0   379M   165M uwait   6  96:19   0.00% Plex Media Server
53251 root          1  20    0   167M   140M select  5   0:00   0.00% smbd
 1392 root          1  20    0   162M   137M select  4   0:27   0.00% smbd
  139 root          4  20    0   202M   135M usem    7   6:04   0.00% python3.7
  138 root          4  20    0   177M   135M usem    4   6:03   0.00% python3.7
  141 root          4  20    0   179M   135M usem    6   6:21   0.00% python3.7
  140 root          4  20    0   178M   135M usem    2   6:04   0.00% python3.7
  137 root          4  20    0   185M   134M piperd  4   6:03   0.00% python3.7
 1578 root         15  21    0   179M   126M umtxn   1   0:02   0.00% uwsgi-3.7
 2705 plex         13  52   15   176M   124M piperd  1  27:40   0.00% Plex Script Host
 1430 root          1  20    0   120M 99160K select  5   0:01   0.00% smbd
 1428 root          1  20    0   120M 98592K select  3   0:01   0.00% smbd
 1506 root          1  20    0   128M 95740K kqread  5   0:53   0.00% uwsgi-3.7
 3331 plex         13  52   15   136M 79624K piperd  5  27:16   0.00% Plex Script Host
  527 root          4  20    0 91788K 76508K usem    4   1:58   0.00% python3.7


Screen Shot 2020-05-18 at 9.34.13 PM.png

Screen Shot 2020-05-18 at 9.35.05 PM.png
 

MikeyG

Patron
Joined
Dec 8, 2017
Messages
442
Similar issue here. Services shows a lot of memory. Only jail/plugin is netdata which clearly isn't using that much memory.
1589873411514.png


Top doesn't indicate any service that's actually using that much though:
Code:
last pid: 57059;  load averages:  0.19,  0.40,  0.38  up 16+02:57:43    00:30:51
108 processes: 1 running, 107 sleeping

Mem: 195M Active, 45G Inact, 1154M Laundry, 135G Wired, 5378M Free
ARC: 108G Total, 100G MFU, 7295M MRU, 101M Anon, 558M Header, 274M Other
     102G Compressed, 114G Uncompressed, 1.12:1 Ratio
Swap: 10G Total, 10G Free


  PID USERNAME    THR PRI NICE   SIZE    RES STATE   C   TIME    WCPU COMMAND
   78 root         60  21    0   629M   577M kqread  1 145:16   0.00% python3.7
18229    302       19  52   19   289M   259M pause   7 188:22   0.20% netdata
 1600 root         15  20    0   189M   150M umtxn   7   0:46   0.00% uwsgi-3.7
  135 root          4  20    0   205M   147M usem    5   6:16   0.00% python3.7
  138 root          4  20    0   177M   147M piperd  2   6:20   0.00% python3.7
  136 root          4  20    0   177M   147M usem    7   6:32   0.00% python3.7
  137 root          4  20    0   179M   146M usem    1   6:29   0.00% python3.7
  139 root          4  20    0   177M   146M usem    6   6:20   0.00% python3.7
49563 root          1  20    0   146M   132M select  6   6:39   0.00% smbd
56331 root          1  20    0   148M   132M select  1   1:04   0.00% smbd
28780 root          1  20    0   144M   131M select  6   4:51   0.00% smbd
49537 root          1  20    0   144M   129M select  6   8:19   0.00% smbd
49575 root          1  20    0   144M   129M select  7   0:06   0.00% smbd
81782 root          1  20    0   143M   128M select  1   0:02   0.00% smbd
49577 root          1  20    0   144M   127M select  0   1:09   0.00% smbd
49578 root          1  20    0   140M   126M select  1   2:56   0.00% smbd
49606 root          1  20    0   141M   126M select  6   0:01   0.00% smbd
49576 root          1  20    0   139M   125M select  1   0:55   0.00% smbd


I have also noticed that my target size for ARC is much lower than total memory. Nothing I do seems to increase that target. Even doing lots of random access within VMs:


ARC Size: 58.16% 108.09 GiB
Target Size: (Adaptive) 58.08% 107.94 GiB
Min Size (Hard Limit): 12.50% 23.23 GiB
Max Size (High Water): 8:1 185.85 GiB


Could be totally different things and I'm not understanding how target ARC is supposed to adjust, but thought I'd mention it since something appears to be holding onto a lot of memory.
 

dirtyfreebooter

Explorer
Joined
Oct 3, 2020
Messages
72
I am seeing similar issues with TrueNAS Core RC1 on system with 256GB of memory. Moving from an old Ubuntu box, I was transferring data via NFS mount. NFS Client == TrueNAS, NFS server == Old machine.

at one point i had 190GB of service memory. looking at top, it was all in "Inactive" category. I unmounted the the NFS mount and instantly the inactive category went to a few hundred MBs and ZFS arc was able to finally use up all the memory I got for it!

Not sure if this is just a FreeBSD issue, or something you can tune with sysctl to tell the OS not to go crazy.. but one workaround so that my ZFS arc isn't at 2GB was to set the vfs.zfs.arc_max and vfs.zfs.arc_min to keep the arc cache in the ranges I deem acceptable...
 

thirdgen89gta

Dabbler
Joined
May 5, 2014
Messages
32
I am seeing similar issues with TrueNAS Core RC1 on system with 256GB of memory. Moving from an old Ubuntu box, I was transferring data via NFS mount. NFS Client == TrueNAS, NFS server == Old machine.

at one point i had 190GB of service memory. looking at top, it was all in "Inactive" category. I unmounted the the NFS mount and instantly the inactive category went to a few hundred MBs and ZFS arc was able to finally use up all the memory I got for it!

Not sure if this is just a FreeBSD issue, or something you can tune with sysctl to tell the OS not to go crazy.. but one workaround so that my ZFS arc isn't at 2GB was to set the vfs.zfs.arc_max and vfs.zfs.arc_min to keep the arc cache in the ranges I deem acceptable...
It’s been much better for me recently. But I also did notice a pattern that the service memory does increase when I copy files to the server. And NFS is my primary file share protocol.

however one of the things I did try was restart all the services one at a time. And NFS was one of them, but made no difference in memory usage. However I didn’t unmount the shares.

I’ll have to look at the sysctls you mentioned
 

Zorlack01

Cadet
Joined
Nov 27, 2020
Messages
4
Hello,

Are you using tmpfs for any of your jails? Run mount | grep tmpfs and look for duplicates.
 

thirdgen89gta

Dabbler
Joined
May 5, 2014
Messages
32
Hello,

Are you using tmpfs for any of your jails? Run mount | grep tmpfs and look for duplicates.
No, none of the jails are using tmpfs


Code:
Asgard% mount|grep tmpfs
tmpfs on /etc (tmpfs, local)
tmpfs on /mnt (tmpfs, local)
tmpfs on /var (tmpfs, local)
Asgard% uname -a
FreeBSD Asgard.local 12.2-RC3 FreeBSD 12.2-RC3 7c4ec6ff02c(HEAD) TRUENAS  amd64
Asgard%
 

HenchRat

Dabbler
Joined
Nov 27, 2020
Messages
38
I'm seeing a similar issue with TrueNAS 12.0-RELEASE, which uname -a shows as 12.2-RC3.

No Jails/Plugins running (though a couple are installed), but am running 3 VMs, with 4GB, 8GB and 4 GB allocated to each, respectively.

The Virtual Machines tab says there is 0.10 bytes of memory available, but the dashboard says that of 64GB, I have 25.9GB free, 8GB used by ZFS Cache, and 29.9 GB used by Services. Not sure why that 25.9GB isn't available to VMs.

I set the vfs.zfs.arc_max sysctl tunable to 32212254720 bytes via the GUI after seeing this issue and am still seeing exhaustion. That is the only tunable I have set.

Top says:
Code:
Mem: 1588M Active, 11G Inact, 5270M Laundry, 19G Wired, 26G Free
ARC: 8176M Total, 634M MFU, 6872M MRU, 7052K Anon, 40M Header, 623M Other
     6784M Compressed, 7675M Uncompressed, 1.13:1 Ratio
Swap: 4096M Total, 286M Used, 3810M Free, 6% Inuse


mount | grep tempfs says:

Code:
tmpfs on /etc (tmpfs, local)
tmpfs on /mnt (tmpfs, local)
tmpfs on /var (tmpfs, local)


I'm running the following services:
rsync
SMART
SMB
UPS

I turned each service off and then on again in turn, and observed no change to memory usage.
 
Top