I/O Performance Planning

Status
Not open for further replies.

zeroluck

Dabbler
Joined
Feb 12, 2015
Messages
43
I am currently in the process of moving our FreeNAS boxes from experimental-ish production to 5 year, solid, don't-touch-them-again production. With this goal in mind I'm trying to do some math to ensure that what I build can handle the IOPS load in the long run. Right now I'm just running single, big RaidZ2 sets on each array. Here is how I'm going about the calculations:

I am using WD RED disks. These aren't very fast, but originally these boxes were just supposed to hold video recordings for a year or two from the surveillance system, so we're pretty much stuck with those at this point.

Basically, according to this link http://www.ryanfrantz.com/posts/calculating-disk-iops/ we can calculate IOPS for a single disk like this: IOPS = 1/(avgLatency + AvgSeek). For a WD Red 3TB, that = 30.4136253.

This review http://www.storagereview.com/western_digital_red_nas_hard_drive_review_wd30efrx puts the WD30EFRX at 45 IOPS read and 112 IOPS write. According to some performance analytics I've been running on these applications and arrays with Dell DPACK2, perfmon and nmon, my read/write load balance is 71% reads /29% writes.

It is also commonly stated that a RAIDZ volume's write performance is only as good as a single disk's IOPS, so if I am going to use RAIDZ, it's important to understand how much that really is.

I've also been monitoring the read and write IOPS on the arrays and applications and I keep coming up with very similar numbers over 4 day 1 second sample times. I am seeing way more IOPS than either of these arrays should be able to do according to the rule of RAIDZ volume's write performance is only as good as a single disk's IOPS. I am doing super random writes that can't possibly be all being cached. MY ARC hit ratio is about 99& but my L2ARC SSDs are only hitting 14-25%, so I don't think that is it.

My question is, if that rule is true, how am I seeing 800+ IOPS at 95% occur on these arrays that should be limited to 30IOPS of writes? By my math, if I have a ~30% write load and 800 IOPS, that is 240 write IOPS occurring at my 95th percentile.
 

joeschmuck

Old Man
Moderator
Joined
May 28, 2011
Messages
10,994
How much RAM do you have?

I'm not knowledgeable on all those IOPS rates but I'm curious why you don't think it's because of your ARC? Maybe it's how you are determining the IOPS?

If you really want to test something like this out specific to your hardware then you could do a little experiment like reducing your RAM to 8GB, removing your L2ARC, and then giving it a real test to see how slow things go.

Have you tried any benchmark applications? Of course the file size for any testing really needs to be much larger than the size of your ARC.
 

jgreco

Resident Grinch
Joined
May 29, 2011
Messages
18,680
You've got a question that is not obviously related to, but nevertheless is actually closely related to, fragmentation and mitigation.

ZFS is a CoW filesystem and it does things differently. Write blocks "randomly" into a file and yet they may be written as contiguous disk blocks. Plus they get cached in ARC.

ARC (and L2ARC) mitigate seek speed issues for data that can be held in ARC.

So to do your tests for real, use 8GB of RAM, fill your pool to 80% capacity with garbage data, then make sure you're testing on many gigs (64GB+) of data in the remaining space. Run tests a bunch of times until you get consistent speeds.
 

joeschmuck

Old Man
Moderator
Joined
May 28, 2011
Messages
10,994
What he said
 

jgreco

Resident Grinch
Joined
May 29, 2011
Messages
18,680
Minus the tyops. Hate typing on a cell phone. Anyways the real problem is that whatever your tool is doing to test IOPS and whatever the ZFS reality is, those things probably don't jibe quite right. In order to get a real idea of what IOPS are like on the raw pool, you probably want heavy fragmentation to exist, and nothing to "help" mitigate that.

What I'd want to show you is this:

delphix-small.png


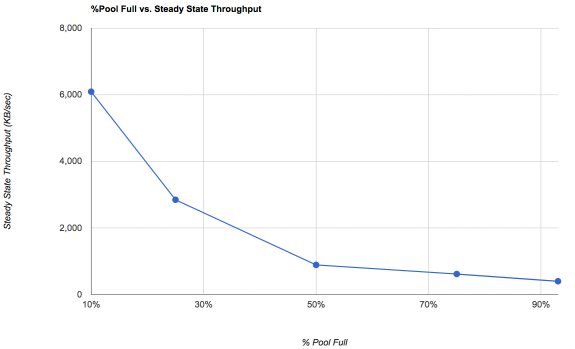
That's random I/O on a single disk. Notice that at low percentage full, the IOPS per second is implied to be around 1500 IOPS/sec (6MB-per-sec divided by 4K sector size) but as the pool fill gets to 80%, that's 125 IOPS/sec (500KB-per-sec divided by 4K sector size) which more closely reflects the random seek speeds of a single spindle.

The problem is that *sequential* writes degrade in the same manner, because ZFS write speeds are tied much more closely to how quickly a new block can be allocated than to anything else. You can be writing random blocks in a file, or contiguous blocks in a file, and in both cases a similar sort of allocation happens - ZFS looks for a free block to allocate and tries to find a range of contiguous blocks for any further allocations that need to happen in the immediate future. Simple, huh. Writing to random blocks within a file do not overwrite the old block within the file, so there's no reason to think that random seek-and-writes within a file will do anything to create more IOPS on the pool - this is the classic misunderstanding of what ZFS *means*. They're likely to be written sequentially somewhere else on disk. That only begins to break down as the pool gets full, which is fragmentation, which is what the graph above is really showing.

The pool fill graph above isn't easily tested because it is actually showing what happens AFTER a pool is fragmented and has reached steady state performance. This could be after a year of runtime that you finally settle in to an IOPS number. Makes it harder to benchmark.

So, smart admins do two or three things to artificially boost their IOPS far beyond anything that the disks themselves could support normally:

1) You increase the amount of pool space and never try to use it all. Please notice in particular that a pool that's 25% full can write THREE times faster than a pool that's 50% full. So shoot for lots of free disk space.

2) You increase the amount of ARC and L2ARC to mitigate the read seek hit that ultimately hurts you when you experience high fragmentation. Of course, this only helps the stuff you read frequently.

3) You use mirror vdevs rather than RAIDZ to increase the IOPS capacity (and in particular the read IOPS capacity). You can extend it out to three-way mirrors.

To give you an example, the VM filer here has a 14TB pool made out of seven sets of three 2TB drives in mirror. That gives LOTS of read IOPS and pretty good write IOPS. Then, we've committed not to fill it past 7TB, leaving lots of free space for writes to help reduce fragmentation. Then we've put it on a system with 128GB of RAM and 1TB of L2ARC, which means that most reads are handled either by ARC or L2ARC, which covers fully 1/7th of the storage capacity of the device. This will, of course, have massive numbers of read IOPS for anything in the {,L2}ARC, pretty good read IOPS for anything coming from the pool, and fairly decent write IOPS for anything being written. All of those numbers will be FAR above what the individual HDD numbers would be in a conventional RAID.
 

zeroluck

Dabbler
Joined
Feb 12, 2015
Messages
43
Although I am familar with WIFS, I think this thread has cleared it up for me, especially jgreco's long post. I have 64GB of RAM on both my production arrays. So the boost in write IOPS beyond that of a single disk on a RAIDZ setup is related to the WIFS.

I think it can be summarized like this: "RAIDZ performance is similar to that of a single member disk in the array when the filesystem is already fragmented and will perform better when ample free space is availble to write random writes as sequtential/contiguous blocks"
 

jgreco

Resident Grinch
Joined
May 29, 2011
Messages
18,680
Approximately sorta correct. However, it doesn't apply just to random writes - it really applies to ALL writes. As the pool fills, sequential write performance falls too.
 

Steven Sedory

Explorer
Joined
Apr 7, 2014
Messages
96
Minus the tyops. Hate typing on a cell phone. Anyways the real problem is that whatever your tool is doing to test IOPS and whatever the ZFS reality is, those things probably don't jibe quite right. In order to get a real idea of what IOPS are like on the raw pool, you probably want heavy fragmentation to exist, and nothing to "help" mitigate that.

What I'd want to show you is this:

delphix-small.png


That's random I/O on a single disk. Notice that at low percentage full, the IOPS per second is implied to be around 1500 IOPS/sec (6MB-per-sec divided by 4K sector size) but as the pool fill gets to 80%, that's 125 IOPS/sec (500KB-per-sec divided by 4K sector size) which more closely reflects the random seek speeds of a single spindle.

The problem is that *sequential* writes degrade in the same manner, because ZFS write speeds are tied much more closely to how quickly a new block can be allocated than to anything else. You can be writing random blocks in a file, or contiguous blocks in a file, and in both cases a similar sort of allocation happens - ZFS looks for a free block to allocate and tries to find a range of contiguous blocks for any further allocations that need to happen in the immediate future. Simple, huh. Writing to random blocks within a file do not overwrite the old block within the file, so there's no reason to think that random seek-and-writes within a file will do anything to create more IOPS on the pool - this is the classic misunderstanding of what ZFS *means*. They're likely to be written sequentially somewhere else on disk. That only begins to break down as the pool gets full, which is fragmentation, which is what the graph above is really showing.

The pool fill graph above isn't easily tested because it is actually showing what happens AFTER a pool is fragmented and has reached steady state performance. This could be after a year of runtime that you finally settle in to an IOPS number. Makes it harder to benchmark.

So, smart admins do two or three things to artificially boost their IOPS far beyond anything that the disks themselves could support normally:

1) You increase the amount of pool space and never try to use it all. Please notice in particular that a pool that's 25% full can write THREE times faster than a pool that's 50% full. So shoot for lots of free disk space.

2) You increase the amount of ARC and L2ARC to mitigate the read seek hit that ultimately hurts you when you experience high fragmentation. Of course, this only helps the stuff you read frequently.

3) You use mirror vdevs rather than RAIDZ to increase the IOPS capacity (and in particular the read IOPS capacity). You can extend it out to three-way mirrors.

To give you an example, the VM filer here has a 14TB pool made out of seven sets of three 2TB drives in mirror. That gives LOTS of read IOPS and pretty good write IOPS. Then, we've committed not to fill it past 7TB, leaving lots of free space for writes to help reduce fragmentation. Then we've put it on a system with 128GB of RAM and 1TB of L2ARC, which means that most reads are handled either by ARC or L2ARC, which covers fully 1/7th of the storage capacity of the device. This will, of course, have massive numbers of read IOPS for anything in the {,L2}ARC, pretty good read IOPS for anything coming from the pool, and fairly decent write IOPS for anything being written. All of those numbers will be FAR above what the individual HDD numbers would be in a conventional RAID.

I'm building a hyper-v VM box as well and I'm curious with the setup above that you mentioned at 50% capacity or below what iops and what transfer speeds are you getting?
 

gpsguy

Active Member
Joined
Jan 22, 2012
Messages
4,472
You necro'd a 10 month old thread. jgreco hasn't been an active member on the forums for 3-4 months.

I'm building a hyper-v VM box as well ...
 

Stux

MVP
Joined
Jun 2, 2016
Messages
4,419
You necro'd a 10 month old thread. jgreco hasn't been an active member on the forums for 3-4 months.

He dropped in a couple of weeks ago ;)
 
Status
Not open for further replies.
Top