I'm new to freenas 8.3
I need help on how to interpret the monitoring graphs.
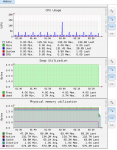
They have cpu going to 200 percent on a single core A64 3200
CPU Usage
idle - 125.59 ave 133.00 max 130.80 last
Nice all zeros
User 6.82 ave 131.45 max 28.85 last
System .62 avg 3.80 max 1.05 last
IQR 0.00 avg 0.10 max
And memory they have
free
active
cache
inactive
wired

Why do they use 200 percent scale? does this mean 6.82 average is really 6.82/2?
Thanks.
I need help on how to interpret the monitoring graphs.
They have cpu going to 200 percent on a single core A64 3200
CPU Usage
idle - 125.59 ave 133.00 max 130.80 last
Nice all zeros
User 6.82 ave 131.45 max 28.85 last
System .62 avg 3.80 max 1.05 last
IQR 0.00 avg 0.10 max
And memory they have
free
active
cache
inactive
wired

Why do they use 200 percent scale? does this mean 6.82 average is really 6.82/2?
Thanks.
