
Mark Francis
Cadet
- Joined
- Nov 17, 2016
- Messages
- 9
Hello,
I'm running FreeNAS-11.0-U3 (c5dcf4416) in a Proxmox hypervisor.
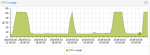
Every so often (and a lot recently) the server will become unresponsive on it's web gui and shares. When I login to my hypervisor, I can see the server showing the web user interface on 0.0.0.0. A reboot will fix this for a small amount of time. It also seems to spike the cpu beyond normal (see image. All spikes are these events). I know I don't have a bad cable because the other VM's remain up and working. It's also not IP conflicts, since this VM's IP is set by DHCP.
I'm more of a linux guy, so am not really sure how to approach troubleshooting this. My first thought was filled systems partitions, which I can see a few tiny ones at 100%, but they are small so I expect this is usual?
Does anyone have any ideas how I can approach troubleshooting this?
I'm running FreeNAS-11.0-U3 (c5dcf4416) in a Proxmox hypervisor.
Every so often (and a lot recently) the server will become unresponsive on it's web gui and shares. When I login to my hypervisor, I can see the server showing the web user interface on 0.0.0.0. A reboot will fix this for a small amount of time. It also seems to spike the cpu beyond normal (see image. All spikes are these events). I know I don't have a bad cable because the other VM's remain up and working. It's also not IP conflicts, since this VM's IP is set by DHCP.
I'm more of a linux guy, so am not really sure how to approach troubleshooting this. My first thought was filled systems partitions, which I can see a few tiny ones at 100%, but they are small so I expect this is usual?
Code:
Filesystem												  Size	Used   Avail Capacity  Mounted on
freenas-boot/ROOT/default								   7.7G	725M	7.0G	 9%	/
devfs													   1.0K	1.0K	  0B   100%	/dev
tmpfs														32M	9.4M	 23M	29%	/etc
tmpfs													   4.0M	8.0K	4.0M	 0%	/mnt
tmpfs													   3.3G	 20M	3.3G	 1%	/var
freenas-boot/grub										   7.0G	6.3M	7.0G	 0%	/boot/grub
fdescfs													 1.0K	1.0K	  0B   100%	/dev/fd
tempvol													 105G	104G	839M	99%	/mnt/<redacted>
vol1														5.2T	614G	4.6T	11%	/mnt/<redacted>
tempvol/.system											 1.3G	508M	839M	38%	/var/db/system
tempvol/.system/cores									   859M	 19M	839M	 2%	/var/db/system/cores
tempvol/.system/samba4									  840M	396K	839M	 0%	/var/db/system/samba4
tempvol/.system/syslog-d6d294a404024d4b9f621e6bf1afa53c	 844M	4.4M	839M	 1%	/var/db/system/syslog-d6d294a404024d4b9f621e6bf1afa53c
tempvol/.system/rrd-d6d294a404024d4b9f621e6bf1afa53c		854M	 15M	839M	 2%	/var/db/system/rrd-d6d294a404024d4b9f621e6bf1afa53c
tempvol/.system/configs-d6d294a404024d4b9f621e6bf1afa53c	858M	 18M	839M	 2%	/var/db/system/configs-d6d294a404024d4b9f621e6bf1afa53c
Does anyone have any ideas how I can approach troubleshooting this?
Attachments
Last edited: