Viraj Bhujbal
Cadet
- Joined
- Sep 19, 2016
- Messages
- 9
Hello Team,
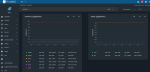
I'm trying to understand the memory graph on dashboard. For every status (active/laundry/free/wired/cache/inactive), there are mentioned capacity as min, max avg & total (all in GiB). Wanted to know what this total stands for. Total for free status shows 4601GiB, for wired it shows something near to 574GiB & for active status total field is somewhere around 105GiB.
I've a FreeNAS Mini with Intel Atom C2750 (8 cores | 2.40GHz), 16GB RAM & 4 x 1TB HDD.
Screenshot is attached for memory graph.
Thanks in advance!!