80% capacity fill rule - How far past that is safe?

Status
Not open for further replies.

gpsguy

Active Member
Joined
Jan 22, 2012
Messages
4,472

mattlach

Patron
Joined
Oct 14, 2012
Messages
280
If you've mostly been adding to it, I'm not sure where the 16% frag is coming from. I've got 9% frag on a 40T pool that's 50% full and is theoretically archival in nature but in practice may see more deletes than I'd care for. :)

I'm not 100% sure, but I'm guessing the 16% frag is caused by a combination of the fact that I let it get to 88% full, and the fact that my fiance's Mac's Time Machine backs up to it.

I should have checked how fragmented it was before I removed 3-4TB of DVR files to get it down below 80%.
 

mattlach

Patron
Joined
Oct 14, 2012
Messages
280
That's not actually what it's doing. It's flagging prefetched data as ineligible for eviction to L2ARC. If you have lots of data that's being prefetched (and probably more than once) then turning this to zero might be very useful.

Of course you're risking some significant additional wear and tear on your SSD. ZFS disables this because generally it is cheap to prefetch stuff from a pool; you usually want L2ARC to accelerate the stuff that's *hard* to get off your pool (i.e. involves seeks).

So, my L2ARC Samsung 850 Pro SSD's use 3D MLC NAND, which results in about 6000 write cycles. As of today only 691 write cycles have been used in 17 months. This means I have over 10 years of use left at this rate. Considering they will likely be obsolete well before then, I feel I have plenty of room to up the wear on the drives.

So, I made some changes to the L2ARC tunables to see if I can get some better performance out of them, as follows:

24620492641_68153cf92c_o.jpg


Let's see if it works! :)
 

jgreco

Resident Grinch
Joined
May 29, 2011
Messages
18,680
You'd probably be better off with some non-weirdass-numbers. Try 67108864 (64MBytes) for write_max and 134217728 (128MBytes) for write_boost.
 

mattlach

Patron
Joined
Oct 14, 2012
Messages
280
You'd probably be better off with some non-weirdass-numbers. Try 67108864 (64MBytes) for write_max and 134217728 (128MBytes) for write_boost.

Appreciate the suggestion.

What is the purpose of these limits? Is it just to prevent the L2ARC from writing so much into the cache that there isn't any bandwidth left for reading from it?

Is there a best practice (% of total drive speed) or something like that for these limits?

Since I have two striped SSD's each capable of 550 MB/s read and 470MB/s write, maybe I should go higher?

Much obliged,
Matt
 

jgreco

Resident Grinch
Joined
May 29, 2011
Messages
18,680
Yeah, you want a number that's appropriately sized. In the old days (~2008), a decent Solaris system would be 16GB of RAM, and an SSD like the Intel X25-M 80GB had write characteristics of 70MBytes/sec. You don't really want to squeeze your L2ARC device to the point of being completely busy, so the defaults are quite reasonable for an old SSD like the X25-M.

One of the things you really need to realize is that the goal here isn't to maximize these values. You don't want or need to be evicting every possible thing from the ARC to the L2ARC; rather, you'd like for the most USEFUL stuff to be evicted. That means that a somewhat-too-small window is actually fine. The L2ARC will warm up just fine, it will just take longer. What you don't want is stupid-small to the point where the L2ARC cannot function correctly.

When you look at the scale of a modern system, 128GB of RAM is 8x the 16GB of old, a 512GB SSD is 6.4x the 80GB of old, and the 1500MBytes/sec write of a modern NVMe SSD is 21x the 70MBytes/sec of old. But you'll notice that I'm not jacking up the L2ARC rate as a strict ratio of old SSD speed to new SSD speed. It's probably more useful to look at the overall scale of things. So you'll notice my numbers are just a factor of 8x.

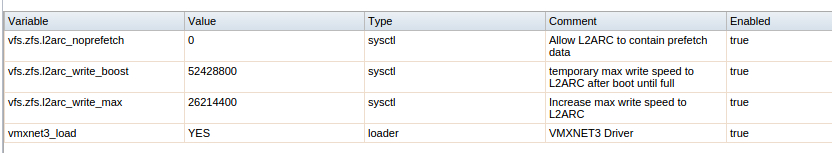
Keep your write_max lowish. I would propose that write_max being half of write_boost, and the sum of the two being no more than half the sequential write speed of the L2ARC device seems to work pretty well. You're trying not to flood the devices with writes. Under normal circumstances that leaves lots of headroom for simultaneous reads, and even under write_boost conditions, a manufacturer's spec is optimistic and doesn't allow for things like garbage collection. But also consider the size of your RAM, and don't make the numbers unrealistically large. A system with less RAM should favor somewhat smaller numbers than a system with more RAM.
 

mattlach

Patron
Joined
Oct 14, 2012
Messages
280
Yes, but only if they're actually happening truly concurrently. ZFS is very good about optimizing. For example, if you're sequentially reading a file, ZFS will assume that you will be reading more of the file, and it will not be reading tiny little blocks on demand, but will instead prefetch. Go to your CLI, and type "arc_summary.py" and look under "File Level Prefetch". My filers are usually seeing an ~80-90% hit ratio, except for the filers with a tiny amount of RAM.

To go back to this for a moment, what time period does this script provide a summary for? Since boot?
 

jgreco

Resident Grinch
Joined
May 29, 2011
Messages
18,680
It's just summarizing things that it gathers from the kernel, so whatever the underlying values represent. I would guess that in most cases it is "since pool import" or "since boot" depending on the nature of the underlying values.
 

mattlach

Patron
Joined
Oct 14, 2012
Messages
280
It's just summarizing things that it gathers from the kernel, so whatever the underlying values represent. I would guess that in most cases it is "since pool import" or "since boot" depending on the nature of the underlying values.

Yeah, that is what I would have guessed too, but if you look at many of the totals on the far right (182.44m, 61.78m, 122.46m, etc.) they seem far too small to be the totals since boot, especially with all the activity my box sees...

Code:
ARC Total accesses:                                     244.22m
        Cache Hit Ratio:                74.70%  182.44m
        Cache Miss Ratio:               25.30%  61.78m
        Actual Hit Ratio:               50.14%  122.46m

        Data Demand Efficiency:         98.09%  36.02m
        Data Prefetch Efficiency:       50.16%  118.59m

        CACHE HITS BY CACHE LIST:
          Anonymously Used:             31.16%  56.85m
          Most Recently Used:           17.74%  32.36m
          Most Frequently Used:         49.39%  90.10m
          Most Recently Used Ghost:     0.33%   604.77k
          Most Frequently Used Ghost:   1.39%   2.53m

        CACHE HITS BY DATA TYPE:
          Demand Data:                  19.36%  35.33m
          Prefetch Data:                32.61%  59.49m
          Demand Metadata:              46.53%  84.90m
          Prefetch Metadata:            1.50%   2.73m

        CACHE MISSES BY DATA TYPE:
          Demand Data:                  1.11%   688.74k
          Prefetch Data:                95.67%  59.10m
          Demand Metadata:              1.53%   948.20k
          Prefetch Metadata:            1.69%   1.04m


Based on this, I am guessing it must be some sort of time period instead, but I am not sure.


Also, those tweaks to the L2ARC settings dramatically increased my hit rates in L2ARC. Still a bit lower than I had hoped though. It was up to 27% yesterday (from 0.89% before the tweaks)

Do be aware that installing L2ARC robs you of ARC; the pointers (think: index) into the L2ARC are stored in the ARC. If you are not seeing good behaviour out of the L2ARC, you're better off using that RAM for the regular ARC.

Do any of the line items spit out by the arc_summary.py correspond to this pointer size in RAM? It would be nice to be able to quantify how much RAM the L2ARC is causing to be used in order to determine if it is worth keeping.
 

jgreco

Resident Grinch
Joined
May 29, 2011
Messages
18,680
You're looking for the L2ARC header size,

# sysctl -q kstat.zfs.misc.arcstats.l2_hdr_size

or probably somewhere in arc_summary too.
 
Status
Not open for further replies.
Top