2 Currently_unreadable_sectors, but zero errors nor reallocs

Status
Not open for further replies.

Osiris

Contributor
Joined
Aug 15, 2013
Messages
148
Lads,

What's your opinion here.
I'm not looking for the obvious 'Replace the disk asap !!1!' comments.
This disk has regular smart scans and more than exhaustive usage.
No real critical data onhere.
It's my download-temp array of 8TB (6TB available and yes, I need it)
If it was failing, it definately would have already.
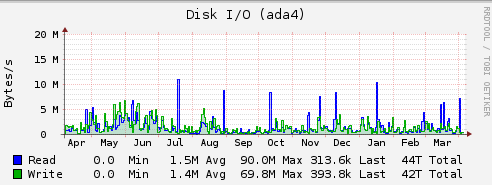
upload_2016-4-5_17-7-49.png


The Current_Pending_Sector count has been on '2' for 6 months now.
Zero Reallocations, zero offline uncorrectable, however.
I'm not seeing where this is coming from.
I was waiting to see what would happen as kind of calamity test, to no avail.


Code:
[root@ra] /# smartctl -a /dev/ada4
smartctl 6.3 2014-07-26 r3976 [FreeBSD 9.3-RELEASE-p31 amd64] (local build)
Copyright (C) 2002-14, Bruce Allen, Christian Franke, www.smartmontools.org

=== START OF INFORMATION SECTION ===
Model Family:     Western Digital Red
Device Model:     WDC WD20EFRX-68EUZN0
Serial Number:    WD-WMC4M2476248
LU WWN Device Id: 5 0014ee 60448be33
Firmware Version: 80.00A80
User Capacity:    2,000,398,934,016 bytes [2.00 TB]
Sector Sizes:     512 bytes logical, 4096 bytes physical
Rotation Rate:    5400 rpm
Device is:        In smartctl database [for details use: -P show]
ATA Version is:   ACS-2 (minor revision not indicated)
SATA Version is:  SATA 3.0, 6.0 Gb/s (current: 3.0 Gb/s)
Local Time is:    Tue Apr  5 16:51:13 2016 CEST
SMART support is: Available - device has SMART capability.
SMART support is: Enabled

=== START OF READ SMART DATA SECTION ===
SMART overall-health self-assessment test result: PASSED

General SMART Values:
Offline data collection status:  (0x00) Offline data collection activity
                                        was never started.
                                        Auto Offline Data Collection: Disabled.
Self-test execution status:      (   0) The previous self-test routine completed
                                        without error or no self-test has ever
                                        been run.
Total time to complete Offline
data collection:                (27900) seconds.
Offline data collection
capabilities:                    (0x7b) SMART execute Offline immediate.
                                        Auto Offline data collection on/off support.
                                        Suspend Offline collection upon new
                                        command.
                                        Offline surface scan supported.
                                        Self-test supported.
                                        Conveyance Self-test supported.
                                        Selective Self-test supported.
SMART capabilities:            (0x0003) Saves SMART data before entering
                                        power-saving mode.
                                        Supports SMART auto save timer.
Error logging capability:        (0x01) Error logging supported.
                                        General Purpose Logging supported.
Short self-test routine
recommended polling time:        (   2) minutes.
Extended self-test routine
recommended polling time:        ( 282) minutes.
Conveyance self-test routine
recommended polling time:        (   5) minutes.
SCT capabilities:              (0x703d) SCT Status supported.
                                        SCT Error Recovery Control supported.
                                        SCT Feature Control supported.
                                        SCT Data Table supported.

SMART Attributes Data Structure revision number: 16
Vendor Specific SMART Attributes with Thresholds:
ID# ATTRIBUTE_NAME          FLAG     VALUE WORST THRESH TYPE      UPDATED  WHEN_FAILED RAW_VALUE
  1 Raw_Read_Error_Rate     0x002f   200   200   051    Pre-fail  Always       -       675
  3 Spin_Up_Time            0x0027   177   174   021    Pre-fail  Always       -       4150
  4 Start_Stop_Count        0x0032   100   100   000    Old_age   Always       -       41
  5 Reallocated_Sector_Ct   0x0033   200   200   140    Pre-fail  Always       -       0
  7 Seek_Error_Rate         0x002e   100   253   000    Old_age   Always       -       0
  9 Power_On_Hours          0x0032   077   077   000    Old_age   Always       -       17377
10 Spin_Retry_Count        0x0032   100   253   000    Old_age   Always       -       0
11 Calibration_Retry_Count 0x0032   100   253   000    Old_age   Always       -       0
12 Power_Cycle_Count       0x0032   100   100   000    Old_age   Always       -       41
192 Power-Off_Retract_Count 0x0032   200   200   000    Old_age   Always       -       36
193 Load_Cycle_Count        0x0032   200   200   000    Old_age   Always       -       235
194 Temperature_Celsius     0x0022   101   088   000    Old_age   Always       -       46
196 Reallocated_Event_Count 0x0032   200   200   000    Old_age   Always       -       0
197 Current_Pending_Sector  0x0032   200   200   000    Old_age   Always       -       2
198 Offline_Uncorrectable   0x0030   100   253   000    Old_age   Offline      -       0
199 UDMA_CRC_Error_Count    0x0032   200   200   000    Old_age   Always       -       0
200 Multi_Zone_Error_Rate   0x0008   200   200   000    Old_age   Offline      -       0

SMART Error Log Version: 1
No Errors Logged

SMART Self-test log structure revision number 1
Num  Test_Description    Status                  Remaining  LifeTime(hours)  LBA_of_first_error
# 1  Short offline       Completed without error       00%     17366         -
# 2  Short offline       Completed without error       00%     17126         -
# 3  Extended offline    Completed without error       00%     17037         -
# 4  Short offline       Completed without error       00%     16961         -
# 5  Short offline       Completed without error       00%     16789         -
# 6  Short offline       Completed without error       00%     16678         -
# 7  Short offline       Completed without error       00%     16581         -
# 8  Short offline       Completed without error       00%     16511         -
# 9  Short offline       Completed without error       00%     16416         -
#10  Short offline       Completed without error       00%     16341         -
#11  Short offline       Completed without error       00%     16246         -
#12  Short offline       Completed without error       00%     16176         -
#13  Short offline       Completed without error       00%     16081         -
#14  Short offline       Completed without error       00%     16006         -
#15  Short offline       Completed without error       00%     15911         -
#16  Short offline       Completed without error       00%     15841         -
#17  Short offline       Completed without error       00%     15742         -
#18  Short offline       Completed without error       00%     15672         -
#19  Short offline       Completed without error       00%     15577         -
#20  Short offline       Completed without error       00%     15502         -
#21  Short offline       Completed without error       00%     15407         -

SMART Selective self-test log data structure revision number 1
SPAN  MIN_LBA  MAX_LBA  CURRENT_TEST_STATUS
    1        0        0  Not_testing
    2        0        0  Not_testing
    3        0        0  Not_testing
    4        0        0  Not_testing
    5        0        0  Not_testing
Selective self-test flags (0x0):
  After scanning selected spans, do NOT read-scan remainder of disk.
If Selective self-test is pending on power-up, resume after 0 minute delay.
 

m0nkey_

MVP
Joined
Oct 27, 2015
Messages
2,739
So what are you looking for? Your post isn't very clear. You can provide more detail from smartctl using -X flag instead of -a.

One thing to note, the temperature of your drive (46C) is a tad warm, you may want to look at keeping them a bit cooler, under 40C.
 

jgreco

Resident Grinch
Joined
May 29, 2011
Messages
18,680
Did you have a question in there somewhere? Obviously it's something you know to keep a bit of an eye on, which is about the only thing to say. If it moves on to something more serious-sounding, then maybe do something about it.
 

Osiris

Contributor
Joined
Aug 15, 2013
Messages
148
Thx, m0nkey.
Btw, the -X flag is the abort flag. You meant -x.
Posting info below.

I wanted to know why Freenas gives me an alert on currently unreadable sectors ... which I assume refers to this line.
197 Current_Pending_Sector 0x0032 200 200 000 Old_age Always - 2
I'm trying to find out which sectors are the problem.

Code:
[root@ra] ~# smartctl -x /dev/ada4
smartctl 6.3 2014-07-26 r3976 [FreeBSD 9.3-RELEASE-p31 amd64] (local build)
Copyright (C) 2002-14, Bruce Allen, Christian Franke, www.smartmontools.org

=== START OF INFORMATION SECTION ===
Model Family:     Western Digital Red
Device Model:     WDC WD20EFRX-68EUZN0
Serial Number:    WD-WMC4M2476248
LU WWN Device Id: 5 0014ee 60448be33
Firmware Version: 80.00A80
User Capacity:    2,000,398,934,016 bytes [2.00 TB]
Sector Sizes:     512 bytes logical, 4096 bytes physical
Rotation Rate:    5400 rpm
Device is:        In smartctl database [for details use: -P show]
ATA Version is:   ACS-2 (minor revision not indicated)
SATA Version is:  SATA 3.0, 6.0 Gb/s (current: 3.0 Gb/s)
Local Time is:    Thu Apr 14 11:48:24 2016 CEST
SMART support is: Available - device has SMART capability.
SMART support is: Enabled
AAM feature is:   Unavailable
APM feature is:   Unavailable
Rd look-ahead is: Enabled
Write cache is:   Enabled
ATA Security is:  Disabled, frozen [SEC2]
Wt Cache Reorder: Enabled

=== START OF READ SMART DATA SECTION ===
SMART overall-health self-assessment test result: PASSED

General SMART Values:
Offline data collection status:  (0x00) Offline data collection activity
                                        was never started.
                                        Auto Offline Data Collection: Disabled.
Self-test execution status:      (   0) The previous self-test routine completed
                                        without error or no self-test has ever
                                        been run.
Total time to complete Offline
data collection:                (27900) seconds.
Offline data collection
capabilities:                    (0x7b) SMART execute Offline immediate.
                                        Auto Offline data collection on/off support.
                                        Suspend Offline collection upon new
                                        command.
                                        Offline surface scan supported.
                                        Self-test supported.
                                        Conveyance Self-test supported.
                                        Selective Self-test supported.
SMART capabilities:            (0x0003) Saves SMART data before entering
                                        power-saving mode.
                                        Supports SMART auto save timer.
Error logging capability:        (0x01) Error logging supported.
                                        General Purpose Logging supported.
Short self-test routine
recommended polling time:        (   2) minutes.
Extended self-test routine
recommended polling time:        ( 282) minutes.
Conveyance self-test routine
recommended polling time:        (   5) minutes.
SCT capabilities:              (0x703d) SCT Status supported.
                                        SCT Error Recovery Control supported.
                                        SCT Feature Control supported.
                                        SCT Data Table supported.

SMART Attributes Data Structure revision number: 16
Vendor Specific SMART Attributes with Thresholds:
ID# ATTRIBUTE_NAME          FLAGS    VALUE WORST THRESH FAIL RAW_VALUE
  1 Raw_Read_Error_Rate     POSR-K   200   200   051    -    675
  3 Spin_Up_Time            POS--K   177   174   021    -    4150
  4 Start_Stop_Count        -O--CK   100   100   000    -    41
  5 Reallocated_Sector_Ct   PO--CK   200   200   140    -    0
  7 Seek_Error_Rate         -OSR-K   200   200   000    -    0
  9 Power_On_Hours          -O--CK   076   076   000    -    17587
10 Spin_Retry_Count        -O--CK   100   253   000    -    0
11 Calibration_Retry_Count -O--CK   100   253   000    -    0
12 Power_Cycle_Count       -O--CK   100   100   000    -    41
192 Power-Off_Retract_Count -O--CK   200   200   000    -    36
193 Load_Cycle_Count        -O--CK   200   200   000    -    235
194 Temperature_Celsius     -O---K   101   088   000    -    46
196 Reallocated_Event_Count -O--CK   200   200   000    -    0
197 Current_Pending_Sector  -O--CK   200   200   000    -    2
198 Offline_Uncorrectable   ----CK   100   253   000    -    0
199 UDMA_CRC_Error_Count    -O--CK   200   200   000    -    0
200 Multi_Zone_Error_Rate   ---R--   200   200   000    -    0
                            ||||||_ K auto-keep
                            |||||__ C event count
                            ||||___ R error rate
                            |||____ S speed/performance
                            ||_____ O updated online
                            |______ P prefailure warning

General Purpose Log Directory Version 1
SMART           Log Directory Version 1 [multi-sector log support]
Address    Access  R/W   Size  Description
0x00       GPL,SL  R/O      1  Log Directory
0x01           SL  R/O      1  Summary SMART error log
0x02           SL  R/O      5  Comprehensive SMART error log
0x03       GPL     R/O      6  Ext. Comprehensive SMART error log
0x06           SL  R/O      1  SMART self-test log
0x07       GPL     R/O      1  Extended self-test log
0x09           SL  R/W      1  Selective self-test log
0x10       GPL     R/O      1  NCQ Command Error log
0x11       GPL     R/O      1  SATA Phy Event Counters
0x21       GPL     R/O      1  Write stream error log
0x22       GPL     R/O      1  Read stream error log
0x80-0x9f  GPL,SL  R/W     16  Host vendor specific log
0xa0-0xa7  GPL,SL  VS      16  Device vendor specific log
0xa8-0xb7  GPL,SL  VS       1  Device vendor specific log
0xbd       GPL,SL  VS       1  Device vendor specific log
0xc0       GPL,SL  VS       1  Device vendor specific log
0xc1       GPL     VS      93  Device vendor specific log
0xe0       GPL,SL  R/W      1  SCT Command/Status
0xe1       GPL,SL  R/W      1  SCT Data Transfer

SMART Extended Comprehensive Error Log Version: 1 (6 sectors)
Device Error Count: 20
        CR     = Command Register
        FEATR  = Features Register
        COUNT  = Count (was: Sector Count) Register
        LBA_48 = Upper bytes of LBA High/Mid/Low Registers ]  ATA-8
        LH     = LBA High (was: Cylinder High) Register    ]   LBA
        LM     = LBA Mid (was: Cylinder Low) Register      ] Register
        LL     = LBA Low (was: Sector Number) Register     ]
        DV     = Device (was: Device/Head) Register
        DC     = Device Control Register
        ER     = Error register
        ST     = Status register
Powered_Up_Time is measured from power on, and printed as
DDd+hh:mm:SS.sss where DD=days, hh=hours, mm=minutes,
SS=sec, and sss=millisec. It "wraps" after 49.710 days.

Error 20 [19] occurred at disk power-on lifetime: 14197 hours (591 days + 13 hours)
  When the command that caused the error occurred, the device was active or idle.

  After command completion occurred, registers were:
  ER -- ST COUNT  LBA_48  LH LM LL DV DC
  -- -- -- == -- == == == -- -- -- -- --
  40 -- 51 00 00 00 00 0c 22 c8 f0 40 00  Error: UNC at LBA = 0x0c22c8f0 = 203606256

  Commands leading to the command that caused the error were:
  CR FEATR COUNT  LBA_48  LH LM LL DV DC  Powered_Up_Time  Command/Feature_Name
  -- == -- == -- == == == -- -- -- -- --  ---------------  --------------------
  60 01 00 00 78 00 00 0c 22 c8 f0 40 08     02:50:53.672  READ FPDMA QUEUED
  60 00 a8 00 70 00 00 0c 22 c6 c0 40 08     02:50:53.672  READ FPDMA QUEUED
  60 01 00 00 68 00 00 0c 22 c5 b8 40 08     02:50:53.670  READ FPDMA QUEUED
  60 01 00 00 60 00 00 0c 22 c4 b0 40 08     02:50:53.669  READ FPDMA QUEUED
  60 01 00 00 58 00 00 0c 22 c3 a8 40 08     02:50:53.667  READ FPDMA QUEUED

Error 19 [18] occurred at disk power-on lifetime: 13752 hours (573 days + 0 hours)
  When the command that caused the error occurred, the device was active or idle.

  After command completion occurred, registers were:
  ER -- ST COUNT  LBA_48  LH LM LL DV DC
  -- -- -- == -- == == == -- -- -- -- --
  40 -- 51 00 00 00 00 03 73 75 c8 40 00  Error: WP at LBA = 0x037375c8 = 57898440

  Commands leading to the command that caused the error were:
  CR FEATR COUNT  LBA_48  LH LM LL DV DC  Powered_Up_Time  Command/Feature_Name
  -- == -- == -- == == == -- -- -- -- --  ---------------  --------------------
  61 00 58 00 70 00 00 82 90 77 b0 40 08  9d+10:50:26.563  WRITE FPDMA QUEUED
  60 00 28 00 68 00 00 03 92 10 d8 40 08  9d+10:50:26.563  READ FPDMA QUEUED
  60 00 a8 00 60 00 00 03 73 77 60 40 08  9d+10:50:26.563  READ FPDMA QUEUED
  60 00 58 00 58 00 00 03 73 76 48 40 08  9d+10:50:26.563  READ FPDMA QUEUED
  60 00 b0 00 50 00 00 03 73 75 98 40 08  9d+10:50:26.563  READ FPDMA QUEUED

Error 18 [17] occurred at disk power-on lifetime: 13752 hours (573 days + 0 hours)
  When the command that caused the error occurred, the device was active or idle.

  After command completion occurred, registers were:
  ER -- ST COUNT  LBA_48  LH LM LL DV DC
  -- -- -- == -- == == == -- -- -- -- --
  40 -- 51 00 00 00 00 03 73 75 cf 40 00  Error: UNC at LBA = 0x037375cf = 57898447

  Commands leading to the command that caused the error were:
  CR FEATR COUNT  LBA_48  LH LM LL DV DC  Powered_Up_Time  Command/Feature_Name
  -- == -- == -- == == == -- -- -- -- --  ---------------  --------------------
  60 00 a8 00 40 00 00 03 73 77 60 40 08  9d+10:50:19.565  READ FPDMA QUEUED
  60 00 58 00 38 00 00 03 73 76 48 40 08  9d+10:50:19.565  READ FPDMA QUEUED
  60 00 b0 00 30 00 00 03 73 75 98 40 08  9d+10:50:19.556  READ FPDMA QUEUED
  60 00 58 00 28 00 00 03 73 74 e8 40 08  9d+10:50:19.554  READ FPDMA QUEUED
  60 00 58 00 20 00 00 03 73 74 90 40 08  9d+10:50:19.538  READ FPDMA QUEUED

Error 17 [16] occurred at disk power-on lifetime: 13752 hours (573 days + 0 hours)
  When the command that caused the error occurred, the device was active or idle.

  After command completion occurred, registers were:
  ER -- ST COUNT  LBA_48  LH LM LL DV DC
  -- -- -- == -- == == == -- -- -- -- --
  40 -- 51 00 00 00 00 02 9c 6d 1f 40 00  Error: UNC at LBA = 0x029c6d1f = 43805983

  Commands leading to the command that caused the error were:
  CR FEATR COUNT  LBA_48  LH LM LL DV DC  Powered_Up_Time  Command/Feature_Name
  -- == -- == -- == == == -- -- -- -- --  ---------------  --------------------
  60 01 00 00 00 00 00 02 9c 6e e8 40 08  9d+10:50:07.672  READ FPDMA QUEUED
  60 01 00 00 f8 00 00 02 9c 6d e0 40 08  9d+10:50:07.672  READ FPDMA QUEUED
  60 01 00 00 f0 00 00 02 9c 6c d8 40 08  9d+10:50:07.638  READ FPDMA QUEUED
  61 00 10 00 e8 00 00 28 0f a0 90 40 08  9d+10:50:07.637  WRITE FPDMA QUEUED
  60 01 00 00 e0 00 00 02 9c 6b d0 40 08  9d+10:50:07.636  READ FPDMA QUEUED

Error 16 [15] occurred at disk power-on lifetime: 13556 hours (564 days + 20 hours)
  When the command that caused the error occurred, the device was active or idle.

  After command completion occurred, registers were:
  ER -- ST COUNT  LBA_48  LH LM LL DV DC
  -- -- -- == -- == == == -- -- -- -- --
  40 -- 51 00 00 00 00 02 d0 4d e0 40 00  Error: UNC at LBA = 0x02d04de0 = 47205856

  Commands leading to the command that caused the error were:
  CR FEATR COUNT  LBA_48  LH LM LL DV DC  Powered_Up_Time  Command/Feature_Name
  -- == -- == -- == == == -- -- -- -- --  ---------------  --------------------
  60 00 b0 00 80 00 00 02 d0 4d 60 40 08  1d+06:26:31.655  READ FPDMA QUEUED
  60 00 08 00 78 00 00 02 d1 01 08 40 08  1d+06:26:31.655  READ FPDMA QUEUED
  60 00 10 00 70 00 00 9c 4a 71 90 40 08  1d+06:26:31.655  READ FPDMA QUEUED
  60 00 b0 00 68 00 00 02 d0 4c b0 40 08  1d+06:26:30.598  READ FPDMA QUEUED
  60 00 58 00 68 00 00 02 d0 4a 48 40 08  1d+06:26:30.598  READ FPDMA QUEUED

Error 15 [14] occurred at disk power-on lifetime: 13556 hours (564 days + 20 hours)
  When the command that caused the error occurred, the device was active or idle.

  After command completion occurred, registers were:
  ER -- ST COUNT  LBA_48  LH LM LL DV DC
  -- -- -- == -- == == == -- -- -- -- --
  40 -- 51 00 00 00 00 02 9c 71 ef 40 00  Error: UNC at LBA = 0x029c71ef = 43807215

  Commands leading to the command that caused the error were:
  CR FEATR COUNT  LBA_48  LH LM LL DV DC  Powered_Up_Time  Command/Feature_Name
  -- == -- == -- == == == -- -- -- -- --  ---------------  --------------------
  60 01 00 00 e0 00 00 02 9c 73 08 40 08  1d+06:26:01.328  READ FPDMA QUEUED
  60 01 00 00 d8 00 00 02 9c 72 00 40 08  1d+06:26:01.328  READ FPDMA QUEUED
  60 01 00 00 d0 00 00 02 9c 70 f8 40 08  1d+06:26:01.327  READ FPDMA QUEUED
  60 01 00 00 c8 00 00 02 9c 6f f0 40 08  1d+06:26:01.327  READ FPDMA QUEUED
  ea 00 00 00 00 00 00 00 00 00 00 40 08  1d+06:26:01.276  FLUSH CACHE EXT

Error 14 [13] occurred at disk power-on lifetime: 13556 hours (564 days + 20 hours)
  When the command that caused the error occurred, the device was active or idle.

  After command completion occurred, registers were:
  ER -- ST COUNT  LBA_48  LH LM LL DV DC
  -- -- -- == -- == == == -- -- -- -- --
  40 -- 51 00 00 00 00 02 9c 26 08 40 00  Error: UNC at LBA = 0x029c2608 = 43787784

  Commands leading to the command that caused the error were:
  CR FEATR COUNT  LBA_48  LH LM LL DV DC  Powered_Up_Time  Command/Feature_Name
  -- == -- == -- == == == -- -- -- -- --  ---------------  --------------------
  60 00 a8 00 08 00 00 02 9c 28 18 40 08  1d+06:25:44.484  READ FPDMA QUEUED
  60 01 00 00 00 00 00 02 9c 27 10 40 08  1d+06:25:44.484  READ FPDMA QUEUED
  60 01 00 00 f8 00 00 02 9c 26 08 40 08  1d+06:25:44.484  READ FPDMA QUEUED
  2f 00 00 00 01 00 00 00 00 00 10 40 08  1d+06:25:44.479  READ LOG EXT
  60 00 a8 00 f8 00 00 02 9c 28 18 40 08  1d+06:25:37.902  READ FPDMA QUEUED

Error 13 [12] occurred at disk power-on lifetime: 13556 hours (564 days + 20 hours)
  When the command that caused the error occurred, the device was active or idle.

  After command completion occurred, registers were:
  ER -- ST COUNT  LBA_48  LH LM LL DV DC
  -- -- -- == -- == == == -- -- -- -- --
  40 -- 51 00 00 00 00 02 9c 26 18 40 00  Error: UNC at LBA = 0x029c2618 = 43787800

  Commands leading to the command that caused the error were:
  CR FEATR COUNT  LBA_48  LH LM LL DV DC  Powered_Up_Time  Command/Feature_Name
  -- == -- == -- == == == -- -- -- -- --  ---------------  --------------------
  60 00 a8 00 f8 00 00 02 9c 28 18 40 08  1d+06:25:37.902  READ FPDMA QUEUED
  60 01 00 00 f0 00 00 02 9c 27 10 40 08  1d+06:25:37.902  READ FPDMA QUEUED
  60 01 00 00 e8 00 00 02 9c 26 08 40 08  1d+06:25:37.902  READ FPDMA QUEUED
  2f 00 00 00 01 00 00 00 00 00 10 40 08  1d+06:25:37.897  READ LOG EXT
  60 00 a8 00 e8 00 00 02 9c 28 18 40 08  1d+06:25:34.399  READ FPDMA QUEUED

SMART Extended Self-test Log Version: 1 (1 sectors)
Num  Test_Description    Status                  Remaining  LifeTime(hours)  LBA_of_first_error
# 1  Short offline       Completed without error       00%     17536         -
# 2  Extended offline    Completed without error       00%     17442         -
# 3  Short offline       Completed without error       00%     17366         -
# 4  Short offline       Completed without error       00%     17126         -
# 5  Extended offline    Completed without error       00%     17037         -
# 6  Short offline       Completed without error       00%     16961         -
# 7  Short offline       Completed without error       00%     16789         -
# 8  Short offline       Completed without error       00%     16678         -
# 9  Short offline       Completed without error       00%     16581         -
#10  Short offline       Completed without error       00%     16511         -
#11  Short offline       Completed without error       00%     16416         -
#12  Short offline       Completed without error       00%     16341         -
#13  Short offline       Completed without error       00%     16246         -
#14  Short offline       Completed without error       00%     16176         -
#15  Short offline       Completed without error       00%     16081         -
#16  Short offline       Completed without error       00%     16006         -
#17  Short offline       Completed without error       00%     15911         -
#18  Short offline       Completed without error       00%     15841         -

SMART Selective self-test log data structure revision number 1
SPAN  MIN_LBA  MAX_LBA  CURRENT_TEST_STATUS
    1        0        0  Not_testing
    2        0        0  Not_testing
    3        0        0  Not_testing
    4        0        0  Not_testing
    5        0        0  Not_testing
Selective self-test flags (0x0):
  After scanning selected spans, do NOT read-scan remainder of disk.
If Selective self-test is pending on power-up, resume after 0 minute delay.

SCT Status Version:                  3
SCT Version (vendor specific):       258 (0x0102)
SCT Support Level:                   1
Device State:                        Active (0)
Current Temperature:                    46 Celsius
Power Cycle Min/Max Temperature:     35/51 Celsius
Lifetime    Min/Max Temperature:     24/58 Celsius
Under/Over Temperature Limit Count:   0/0

SCT Temperature History Version:     2
Temperature Sampling Period:         1 minute
Temperature Logging Interval:        1 minute
Min/Max recommended Temperature:      0/60 Celsius
Min/Max Temperature Limit:           -41/85 Celsius
Temperature History Size (Index):    478 (475)

Index    Estimated Time   Temperature Celsius
476    2016-04-14 03:51    46  ***************************
...    ..( 19 skipped).    ..  ***************************
  18    2016-04-14 04:11    46  ***************************
  19    2016-04-14 04:12    47  ****************************
...    ..(  3 skipped).    ..  ****************************
  23    2016-04-14 04:16    47  ****************************
  24    2016-04-14 04:17    46  ***************************
...    ..( 58 skipped).    ..  ***************************
  83    2016-04-14 05:16    46  ***************************
  84    2016-04-14 05:17    45  **************************
...    ..(191 skipped).    ..  **************************
276    2016-04-14 08:29    45  **************************
277    2016-04-14 08:30    46  ***************************
...    ..(154 skipped).    ..  ***************************
432    2016-04-14 11:05    46  ***************************
433    2016-04-14 11:06    45  **************************
...    ..( 35 skipped).    ..  **************************
469    2016-04-14 11:42    45  **************************
470    2016-04-14 11:43    46  ***************************
...    ..(  4 skipped).    ..  ***************************
475    2016-04-14 11:48    46  ***************************

SCT Error Recovery Control:
           Read:     70 (7.0 seconds)
          Write:     70 (7.0 seconds)

Device Statistics (GP Log 0x04) not supported

SATA Phy Event Counters (GP Log 0x11)
ID      Size     Value  Description
0x0001  2            0  Command failed due to ICRC error
0x0002  2            0  R_ERR response for data FIS
0x0003  2            0  R_ERR response for device-to-host data FIS
0x0004  2            0  R_ERR response for host-to-device data FIS
0x0005  2            0  R_ERR response for non-data FIS
0x0006  2            0  R_ERR response for device-to-host non-data FIS
0x0007  2            0  R_ERR response for host-to-device non-data FIS
0x0008  2            0  Device-to-host non-data FIS retries
0x0009  2            5  Transition from drive PhyRdy to drive PhyNRdy
0x000a  2            6  Device-to-host register FISes sent due to a COMRESET
0x000b  2            0  CRC errors within host-to-device FIS
0x000f  2            0  R_ERR response for host-to-device data FIS, CRC
0x0012  2            0  R_ERR response for host-to-device non-data FIS, CRC
0x8000  4      3418982  Vendor specific
 

jgreco

Resident Grinch
Joined
May 29, 2011
Messages
18,680
See those "Error: UNC at LBA = xxxxx = yyyyyy" lines? yyyyyy is the decimal LBA at which errors have been found.
 
Status
Not open for further replies.
Top