SOLVED Very Poor 10GBE Performance

Status
Not open for further replies.

Donny Davis

Contributor
Joined
Jul 31, 2015
Messages
139
So I am better off just putting disks back in those slots and expanding my pool to 18x mirrored Stripes
 

jgreco

Resident Grinch
Joined
May 29, 2011
Messages
18,680
The S320's are not a very fast SSD, so going down to one will most likely be more painful.

No, it won't be. As I said, commits to the ZIL happen sequentially. If you are writing to a single device, or writing to one of six devices but only one at a time, which is a harder thing? Hint: it's managing the round-robin of the six devices. It also means that if any one of the SLOG component devices fail, your SLOG is toast, so your reliability is SIGNIFICANTLY impacted. The only meaningful thing to do is to use two in a mirror, which increases the availability.
 

jgreco

Resident Grinch
Joined
May 29, 2011
Messages
18,680
So I am better off just putting disks back in those slots and expanding my pool to 18x mirrored Stripes

You should do that anyways. Mount the SLOG SSD's inside. Suggest: industrial Velcro, if there's no mounting point available.
 

Donny Davis

Contributor
Joined
Jul 31, 2015
Messages
139
I do have NVME pci-e cards in them, they just don't have the greatest of SSD to back them up. SM951 i do believe is the model of the SSD. They were for a different project that i had on these servers when i was running ceph. Are there any good M.2 options that can be had for *reasonable* monies.

Thanks for your time @jgreco, it has value and is very much appreciated.
 

Donny Davis

Contributor
Joined
Jul 31, 2015
Messages
139
No, it won't be. As I said, commits to the ZIL happen sequentially. If you are writing to a single device, or writing to one of six devices but only one at a time, which is a harder thing? Hint: it's managing the round-robin of the six devices. It also means that if any one of the SLOG component devices fail, your SLOG is toast, so your reliability is SIGNIFICANTLY impacted. The only meaningful thing to do is to use two in a mirror, which increases the availability.


Ok that took a lot longer for me to get than it should have. So it's not about the speed or IO of the zil, latency is much more important. Makes perfect sense when you break it down barney style like that for me. The SLOG is only writing meta-data, its not a cache tiering device.
 

Donny Davis

Contributor
Joined
Jul 31, 2015
Messages
139
And how about that.. Same numbers without the SLOG

./fio --randrepeat=1 --ioengine=libaio --direct=1 --gtod_reduce=1 --name=test --filename=mount/test --iodepth=64 --size=7G --readwrite=randrw --rwmixread=50 --bs=1M

test: (g=0): rw=randrw, bs=1M-1M/1M-1M, ioengine=libaio, iodepth=64

fio-2.0.9

Starting 1 process

Jobs: 1 (f=1): [m] [100.0% done] [147.9M/143.9M /s] [147 /143 iops] [eta 00m:00s]

test: (groupid=0, jobs=1): err= 0: pid=1137: Thu Jan 18 22:00:54 2018

read : io=3603.0MB, bw=171468KB/s, iops=167 , runt= 21517msec

write: io=3565.0MB, bw=169659KB/s, iops=165 , runt= 21517msec

cpu : usr=1.23%, sys=6.22%, ctx=930, majf=0, minf=17

IO depths : 1=0.1%, 2=0.1%, 4=0.1%, 8=0.1%, 16=0.2%, 32=0.4%, >=64=99.1%

submit : 0=0.0%, 4=100.0%, 8=0.0%, 16=0.0%, 32=0.0%, 64=0.0%, >=64=0.0%

complete : 0=0.0%, 4=100.0%, 8=0.0%, 16=0.0%, 32=0.0%, 64=0.1%, >=64=0.0%

issued : total=r=3603/w=3565/d=0, short=r=0/w=0/d=0


Run status group 0 (all jobs):

READ: io=3603.0MB, aggrb=171467KB/s, minb=171467KB/s, maxb=171467KB/s, mint=21517msec, maxt=21517msec

WRITE: io=3565.0MB, aggrb=169659KB/s, minb=169659KB/s, maxb=169659KB/s, mint=21517msec, maxt=21517msec


Disk stats (read/write):

vda: ios=10778/10627, merge=1/0, ticks=1162612/1447102, in_queue=2638626, util=99.54%


That is from a VM on a ISCSI mounted pool. (zvol to be specific).

Anything else I can do to make this run faster?

I still have the 600MB/s (as measured on the nic) issue server to server. Doesn't seem to matter 10G/40G, switch, no switch... All the exact same numbers. Read/Write FreeNAS to FreeNAS 60MB/s

Right now it's running a zfs send/rcv... benchmarks like the one above (abeit fio is good) are too synthetic to give you the real deal numbers.

I just can't understand what I am doing wrong here.
 

Donny Davis

Contributor
Joined
Jul 31, 2015
Messages
139
I think I have this figured out. I started to watch the CPU util in top, and when compression is enabled its pinned at 100%.

The attached photo has a little bump and then a big bump. The little one is with compression turned on.

The compression process looks to have been my bottleneck. My little 2.4GHz CPU's just couldn't keep up with the workload.

I will report back with results when I have more to share
 

Attachments

  • freenas-compression.png
    freenas-compression.png
    14.7 KB · Views: 563

Donny Davis

Contributor
Joined
Jul 31, 2015
Messages
139
rsync performance is still not very good at all (same as before), but at least ZFS replication is. This is a large improvement for me.

To be honest I see modest savings in the compression dept, so this is not a loss for me really. I have 150TB of usable space, and not 150TB of requirements.
 

Donny Davis

Contributor
Joined
Jul 31, 2015
Messages
139
The top nic is coming from my oVirt deployment, the bottom from my replication. I think this thread can be marked as solved(ish). I will open a new thread in the right forum if I have more issues.

For now I can't expect 1GB writes and reads over the network without spending more time testing and tuning.

Thanks for your help @jgreco @Nick2253 @SweetAndLow
 

Attachments

  • PostCompressionPerformance.png
    PostCompressionPerformance.png
    31.2 KB · Views: 549

jgreco

Resident Grinch
Joined
May 29, 2011
Messages
18,680
Ok that took a lot longer for me to get than it should have. So it's not about the speed or IO of the zil, latency is much more important. Makes perfect sense when you break it down barney style like that for me. The SLOG is only writing meta-data, its not a cache tiering device.

No problem, this stuff is hard to learn, what's obvious to me isn't always obvious to everyone. I enjoy being able to get you over that rough bit, especially since you figured out the compression issue yourself... suggests to me my time is well spent. ;-)

It may not be a good idea to disable compression completely. You may wish to try different compression algs to see if one performs better. You can switch as needed, previously written data remains compressed with the previous alg, and all the decompression algs are very fast. Compression is almost always faster than writing uncompressed to the raw disk, and should always be faster when reading.
 

Donny Davis

Contributor
Joined
Jul 31, 2015
Messages
139
I needed to come back and correct my statement.

I disabled compression on the replication. I did both the pool and the replication, but in the end only needed to disable compression on the replication.

I also took your advice on doing something better for zil. I have two NVME drives in the server, they aren't great for this workload but have surely yielded respectable results for my synthetic testing. I am using two Samsung SM951's in a stripe for ZIL. They have no power loss protection, and are not the fastest on the market... but I am out of lab dollars for now. I will look into getting an Optane drive for ZIL and use the Samsung drives for L2ARC if I need them.

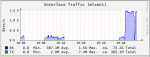
Depending on block size it varies from 100MB/s to 400MB/s

I am asking quite a lot from my cheapy setup, I only have 6K in these two servers and that is not bad for 100TB of usable space. $17/TB usable is not a bad price all things considered. I could probably rebuild my pools is a more space efficient manner and get similar numbers and drive my cost/TB down much further.


Write Test

512k Blocks

./fio --randrepeat=1 --ioengine=libaio --direct=1 --gtod_reduce=1 --name=test --filename=mount/test --iodepth=64 --size=8G --readwrite=randrw --rwmixread=0 --bs=512K
test: (g=0): rw=randrw, bs=512K-512K/512K-512K, ioengine=libaio, iodepth=64
fio-2.0.9
Starting 1 process
Jobs: 1 (f=1): [w] [100.0% done] [0K/185.4M /s] [0 /370 iops] [eta 00m:00s]
test: (groupid=0, jobs=1): err= 0: pid=1108: Fri Jan 19 12:22:24 2018
write: io=8192.0MB, bw=252099KB/s, iops=492 , runt= 33275msec
cpu : usr=1.79%, sys=5.33%, ctx=2065, majf=0, minf=17
IO depths : 1=0.1%, 2=0.1%, 4=0.1%, 8=0.1%, 16=0.1%, 32=0.2%, >=64=99.6%
submit : 0=0.0%, 4=100.0%, 8=0.0%, 16=0.0%, 32=0.0%, 64=0.0%, >=64=0.0%
complete : 0=0.0%, 4=100.0%, 8=0.0%, 16=0.0%, 32=0.0%, 64=0.1%, >=64=0.0%
issued : total=r=0/w=16384/d=0, short=r=0/w=0/d=0

Run status group 0 (all jobs):
WRITE: io=8192.0MB, aggrb=252099KB/s, minb=252099KB/s, maxb=252099KB/s, mint=33275msec, maxt=33275msec

Disk stats (read/write):
vda: ios=0/16335, merge=0/16243, ticks=0/2091323, in_queue=2096702, util=99.77%

1M Blocks
./fio --randrepeat=1 --ioengine=libaio --direct=1 --gtod_reduce=1 --name=test --filename=mount/test --iodepth=64 --size=8G --readwrite=randrw --rwmixread=0 --bs=1M
test: (g=0): rw=randrw, bs=1M-1M/1M-1M, ioengine=libaio, iodepth=64
fio-2.0.9
Starting 1 process
Jobs: 1 (f=1): [w] [100.0% done] [0K/301.8M /s] [0 /301 iops] [eta 00m:00s]
test: (groupid=0, jobs=1): err= 0: pid=1111: Fri Jan 19 12:23:19 2018
write: io=8192.0MB, bw=305451KB/s, iops=298 , runt= 27463msec
cpu : usr=2.20%, sys=6.18%, ctx=1480, majf=0, minf=17
IO depths : 1=0.1%, 2=0.1%, 4=0.1%, 8=0.1%, 16=0.2%, 32=0.4%, >=64=99.2%
submit : 0=0.0%, 4=100.0%, 8=0.0%, 16=0.0%, 32=0.0%, 64=0.0%, >=64=0.0%
complete : 0=0.0%, 4=100.0%, 8=0.0%, 16=0.0%, 32=0.0%, 64=0.1%, >=64=0.0%
issued : total=r=0/w=8192/d=0, short=r=0/w=0/d=0

Run status group 0 (all jobs):
WRITE: io=8192.0MB, aggrb=305451KB/s, minb=305451KB/s, maxb=305451KB/s, mint=27463msec, maxt=27463msec


Read Test
512K Blocks

./fio --randrepeat=1 --ioengine=libaio --direct=1 --gtod_reduce=1 --name=test --filename=mount/test --iodepth=64 --size=8G --readwrite=randrw --rwmixread=100 --bs=512K
test: (g=0): rw=randrw, bs=512K-512K/512K-512K, ioengine=libaio, iodepth=64
fio-2.0.9
Starting 1 process
Jobs: 1 (f=1): [r] [100.0% done] [438.6M/0K /s] [877 /0 iops] [eta 00m:00s]
test: (groupid=0, jobs=1): err= 0: pid=1105: Fri Jan 19 12:21:39 2018
read : io=8192.0MB, bw=425149KB/s, iops=830 , runt= 19731msec
cpu : usr=0.33%, sys=9.06%, ctx=2063, majf=0, minf=17
IO depths : 1=0.1%, 2=0.1%, 4=0.1%, 8=0.1%, 16=0.1%, 32=0.2%, >=64=99.6%
submit : 0=0.0%, 4=100.0%, 8=0.0%, 16=0.0%, 32=0.0%, 64=0.0%, >=64=0.0%
complete : 0=0.0%, 4=100.0%, 8=0.0%, 16=0.0%, 32=0.0%, 64=0.1%, >=64=0.0%
issued : total=r=16384/w=0/d=0, short=r=0/w=0/d=0

Run status group 0 (all jobs):
READ: io=8192.0MB, aggrb=425148KB/s, minb=425148KB/s, maxb=425148KB/s, mint=19731msec, maxt=19731msec

1M Blocks
./fio --randrepeat=1 --ioengine=libaio --direct=1 --gtod_reduce=1 --name=test --filename=mount/test --iodepth=64 --size=8G --readwrite=randrw --rwmixread=100 --bs=1M
test: (g=0): rw=randrw, bs=1M-1M/1M-1M, ioengine=libaio, iodepth=64
fio-2.0.9
Starting 1 process
Jobs: 1 (f=1): [r] [100.0% done] [289.8M/0K /s] [289 /0 iops] [eta 00m:00s]
test: (groupid=0, jobs=1): err= 0: pid=1117: Fri Jan 19 12:33:37 2018
read : io=8192.0MB, bw=404817KB/s, iops=395 , runt= 20722msec
cpu : usr=0.18%, sys=7.75%, ctx=1005, majf=0, minf=17
IO depths : 1=0.1%, 2=0.1%, 4=0.1%, 8=0.1%, 16=0.2%, 32=0.4%, >=64=99.2%
submit : 0=0.0%, 4=100.0%, 8=0.0%, 16=0.0%, 32=0.0%, 64=0.0%, >=64=0.0%
complete : 0=0.0%, 4=100.0%, 8=0.0%, 16=0.0%, 32=0.0%, 64=0.1%, >=64=0.0%
issued : total=r=8192/w=0/d=0, short=r=0/w=0/d=0

Run status group 0 (all jobs):
READ: io=8192.0MB, aggrb=404816KB/s, minb=404816KB/s, maxb=404816KB/s, mint=20722msec, maxt=20722msec

Disk stats (read/write):
vda: ios=24335/1, merge=1/0, ticks=2550564/119, in_queue=2556103, util=99.48%


I could do more synthetic testing, but its not worth the time. I will just put a workload on it, and see where I have issues.


Donny Davis

Contributor
Joined
Jul 31, 2015
Messages
139
With a real workload copying virtual disks from one server to another using oVirt, I am getting the performance I would expect to see. It did require some tuning, but I am a happy camper.

I am marking this thread solved.
 

Attachments

  • mlxen_tuned.png
    mlxen_tuned.png
    18.1 KB · Views: 699

Donny Davis

Contributor
Joined
Jul 31, 2015
Messages
139

Attachments

  • Freenas Tuning.png
    Freenas Tuning.png
    62.3 KB · Views: 709
Status
Not open for further replies.
Top