Hello,
Something unexpected happened on my test setup (AsRockC2750 - 2x8GB (KVR16E11/8I) ECC - 6x2TB RaidZ2) and I'd be glad to have your opinion on it to know if I understood it correcly.
Not sure if this is anyhow relevant but I updated my test server from 9.2.1.8 to 9.10.2 last week. I did a fresh install .
So here is what happened:
And here is what I understand:
Thank you for your help.
Something unexpected happened on my test setup (AsRockC2750 - 2x8GB (KVR16E11/8I) ECC - 6x2TB RaidZ2) and I'd be glad to have your opinion on it to know if I understood it correcly.
Not sure if this is anyhow relevant but I updated my test server from 9.2.1.8 to 9.10.2 last week. I did a fresh install .
So here is what happened:
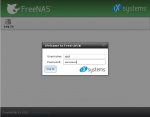
I logged into the GUI of the test server and after entering the credentials, I got a screen with "Forbidden (403) CSRF verification failed. Request aborted." When I tried with a wrong password then I had the correct behaviour (incorrect login message).


I tried with an other browser and also from an other computer as well: same issue.
Then I logged in through Putty but could not get past the password (i.e. I entered the password and then nothing happened).
So I connected to the IPMI and started the remote control console.
I had the expected FreeNAS menu where I selected the shell.
I checked the status of the volume with "
I assumed it was a connection problem (no specific SMART warnings on those drives), I wanted to check in the BIOS and the cables afterwards, so I decided to restart the system.
I don't know why but I used the command "
After a while I tried in the IPMI GUI "Remote control/Server Power Control/Power off server- Orderly shutdown" which was more effective: some processes were ended, some other couldn't so after a while again the system was still up.
Then... well it was late already so I did a "Power off server - Immediate"! :-O
And the next day I powered up the server and... everything worked fine. The disks were all available, the volume was online, a scrub ran without errors.
Almost like nothing happened.


I tried with an other browser and also from an other computer as well: same issue.
Then I logged in through Putty but could not get past the password (i.e. I entered the password and then nothing happened).
So I connected to the IPMI and started the remote control console.
I had the expected FreeNAS menu where I selected the shell.
I checked the status of the volume with "
zpool status" and saw that 3 drives (out of 6) where unavailable.I assumed it was a connection problem (no specific SMART warnings on those drives), I wanted to check in the BIOS and the cables afterwards, so I decided to restart the system.
I don't know why but I used the command "
reboot" (instead of going back to the FreeNAS menu and select reboot but it should do the same), so I typed in " reboot" and enter and I didn't get any feedback, no reaction.After a while I tried in the IPMI GUI "Remote control/Server Power Control/Power off server- Orderly shutdown" which was more effective: some processes were ended, some other couldn't so after a while again the system was still up.
Then... well it was late already so I did a "Power off server - Immediate"! :-O
And the next day I powered up the server and... everything worked fine. The disks were all available, the volume was online, a scrub ran without errors.
scan: resilvered 64.1M in 0h27m with 0 errors on Fri Jan 6 18:10:20 2017Almost like nothing happened.
Code:
# zpool status

  pool: Nasse
 state: ONLINE
status: One or more devices has experienced an unrecoverable error.  An
		attempt was made to correct the error.  Applications are unaffected.
action: Determine if the device needs to be replaced, and clear the errors
		using 'zpool clear' or replace the device with 'zpool replace'.
   see: http://illumos.org/msg/ZFS-8000-9P
  scan: resilvered 64.1M in 0h27m with 0 errors on Fri Jan  6 18:10:20 2017
config:

		NAME												STATE	 READ WRITE CKSUM
		Nasse											   ONLINE	   0	 0	 0
		  raidz2-0										  ONLINE	   0	 0	 0
			gptid/79317b32-4be6-11e4-807c-002590d5437f.eli  ONLINE	   0	 0	 3
			gptid/7a001215-4be6-11e4-807c-002590d5437f.eli  ONLINE	   0	 0	 0
			gptid/7a80b426-4be6-11e4-807c-002590d5437f.eli  ONLINE	   0	 0	 0
			gptid/811506ff-a4ab-11e4-b618-002590d5437f.eli  ONLINE	   0	 0	 0
			gptid/7c1e4f48-4be6-11e4-807c-002590d5437f.eli  ONLINE	   0	 0	 0
			gptid/7cde438e-4be6-11e4-807c-002590d5437f.eli  ONLINE	   0	 0	 0

errors: No known data errors

  pool: freenas-boot
 state: ONLINE
  scan: none requested
config:

		NAME		STATE	 READ WRITE CKSUM
		freenas-boot  ONLINE	   0	 0	 0
		  da0p2	 ONLINE	   0	 0	 0

errors: No known data errors
And here is what I understand:
Well I'm not so worried about the 3 disks becoming unavailable... at least not for now. ;-)
But where I'm a bit more concerned is that the system didn't respond when I tried to log in. Even with 3 disks (or more) unavailable, I should have been able to connect to the GUI or log in with Putty?
I'm thinking: if the system stores data in a dataset on the volume and the volume becomes unavailable (which is what happened) then the system might experience problems. But.. I couldn't find a .system dataset in the volume. On the production server I have a .system dataset but not on the test server.
After searching a while (with
Would that explain the behaviour I observed or did I miss something?
Bonus question: in such cases when something unexpected occurs, I'd check the logs. But I'm not very familiar with FreeNAS's logs. They are located in /var but I don't know were to start to look.
Any advise/pointers on how I could learn more on how to handle logs?
But where I'm a bit more concerned is that the system didn't respond when I tried to log in. Even with 3 disks (or more) unavailable, I should have been able to connect to the GUI or log in with Putty?
I'm thinking: if the system stores data in a dataset on the volume and the volume becomes unavailable (which is what happened) then the system might experience problems. But.. I couldn't find a .system dataset in the volume. On the production server I have a .system dataset but not on the test server.
After searching a while (with
df -h), I found a .system dataset but I'm a bit confused and unsure: does that mean that the .system dataset is mounted as /var/db/system and therefore does not show up in ll /mnt/Nas?Code:
# df -Th

Filesystem											  Type	   Size	Used   Avail Capacity  Mounted on
freenas-boot/ROOT/default							   zfs		7.1G	639M	6.4G	 9%	/
devfs												   devfs	  1.0K	1.0K	  0B   100%	/dev
tmpfs												   tmpfs	   32M	8.5M	 23M	27%	/etc
tmpfs												   tmpfs	  4.0M	8.0K	4.0M	 0%	/mnt
tmpfs												   tmpfs	  5.3G	106M	5.2G	 2%	/var
freenas-boot/grub									   zfs		6.5G	6.5M	6.4G	 0%	/boot/grub
fdescfs												 fdescfs	1.0K	1.0K	  0B   100%	/dev/fd
Nas													 zfs		1.0T	384K	1.0T	 0%	/mnt/Nas
Nas/Document											zfs		2.3T	1.3T	1.0T	55%	/mnt/Nas/Document
Nas/.system											 zfs		1.0T	400K	1.0T	 0%	/var/db/system
Nas/.system/cores									   zfs		1.0T	1.2M	1.0T	 0%	/var/db/system/cores
Nas/.system/samba4									  zfs		1.0T	1.0M	1.0T	 0%	/var/db/system/samba4
Nas/.system/syslog-eab18b758b91471d95803a91d80bfcda	 zfs		1.0T	1.0M	1.0T	 0%	/var/db/system/syslog-   eab18b758b91471d95803a91d80bfcda
Nas/.system/rrd-eab18b758b91471d95803a91d80bfcda		zfs		1.0T	272K	1.0T	 0%	/var/db/system/rrd-eab   18b758b91471d95803a91d80bfcda
Nas/.system/configs-eab18b758b91471d95803a91d80bfcda	zfs		1.0T	1.0M	1.0T	 0%	/var/db/system/configs   -eab18b758b91471d95803a91d80bfcda
Would that explain the behaviour I observed or did I miss something?
Bonus question: in such cases when something unexpected occurs, I'd check the logs. But I'm not very familiar with FreeNAS's logs. They are located in /var but I don't know were to start to look.
Any advise/pointers on how I could learn more on how to handle logs?
Thank you for your help.
