Compress4879
Cadet
- Joined
- Jun 25, 2023
- Messages
- 1
Hi all, I've been researching this issue for a couple weeks now and have had no luck. I recently built this system less than a month ago and the Reporting tab has been completely blank since the installation. The interesting thing is that the widgets on the Dashboard will tell me all the real-time information. These are the things I have tried:
1.) Accessing the GUI with the IP address.
2.) Accessing the GUI from the FDQN (running behind Nginx Proxy Manager in a Docker container on a different Ubuntu server).
3.) Accessing the GUI from Chrome, MS Edge, and Firefox.
4.) Changing the number of graph points in the Reports config.
5.) Rebooting the system.
5.) Every piece of advice from this forum post here and here.
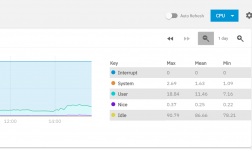
Screenshot of the Dashboard page in case that's helpful in any way:

I don't know if there's something I'm missing here. If anyone has any suggestions, I would absolutely appreciate it. Thank you in advance!
1.) Accessing the GUI with the IP address.
2.) Accessing the GUI from the FDQN (running behind Nginx Proxy Manager in a Docker container on a different Ubuntu server).
3.) Accessing the GUI from Chrome, MS Edge, and Firefox.
4.) Changing the number of graph points in the Reports config.
5.) Rebooting the system.
5.) Every piece of advice from this forum post here and here.
Screenshot of the Dashboard page in case that's helpful in any way:
I don't know if there's something I'm missing here. If anyone has any suggestions, I would absolutely appreciate it. Thank you in advance!