PSA: Dashboard and Reports Pages Rewritten for 11.3

Damianos

iXsystems
iXsystems
Joined
Apr 17, 2017
Messages
44
Hello everybody. There are some big changes coming to the Dashboard and Reports in 11.3 and I wanted to give a little context. This post contains a summary of what is in 11.3 and also what we have planned for 12. The notes about version 12 are included to let you know what we already have on our radar. All this information should give a good overview of where we're at for 11.3 and where we are going for 12. The 11.3 changes are already in the nightlies so you can start testing these now.


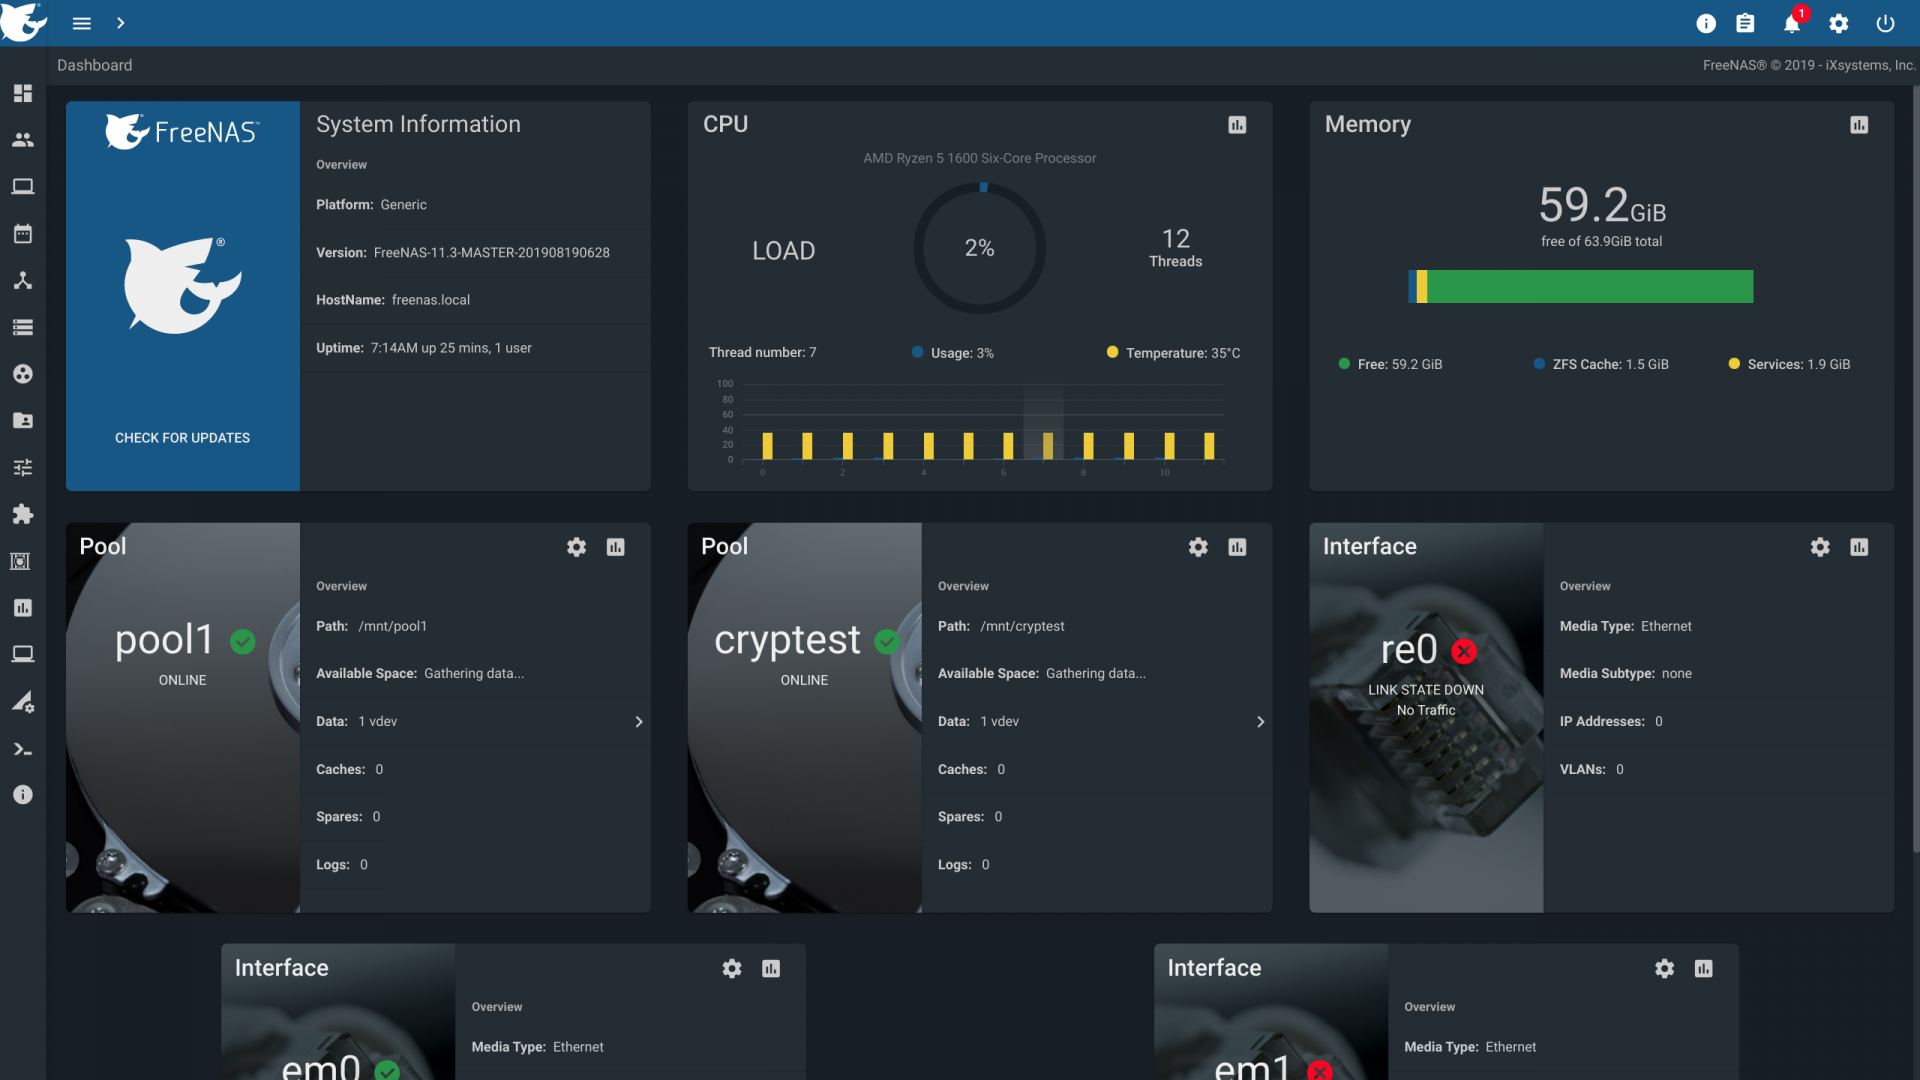
What’s new in the Dashboard in 11.3:
  • A complete change in approach. Dashboard no longer shows historical data and instead aims to provide an overview of the current state of the system. Users should use the reports page for historical data.
  • Line charts are replaced and consolidated using meters and gauges.
  • CPU graphs have been consolidated into a single widget. The CPU widget now provides an average usage stat and per thread stats for both temperature and usage.
  • Middleware now handles the stats data and provides the UI with real time events to power the above charts
  • Taller cards to accommodate more information and prevent text overflows.
  • Interfaces are represented as a separate card per physical NIC unless they are part of a LAGG. Those devices will be incorporated into a LAGG card to avoid redundant UI elements.
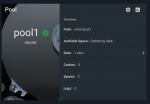
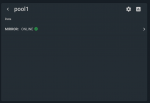
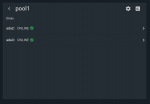
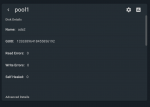
  • Pool and Interface widgets feature mobile inspired lateral navigation. Users can “drill down” to get the data they need without leaving the page. This approach also paves the way for a responsive UI for v12.


Planned Dashboard improvements for FreeNAS 12:
  • Fully responsive UI.
  • Replace last remaining SVG based chart library instances.
  • User configurations. Users will be able to configure which widgets are shown on the dashboard. Drag and drop functionality.
  • More real time stats. Currently middleware is only providing CPU and Memory related real time stats. We would like to expand on this and provide more stats in this manner. Please put in a feature request on Jira for any real time stats you would like to see in the future.

1566225743155.png


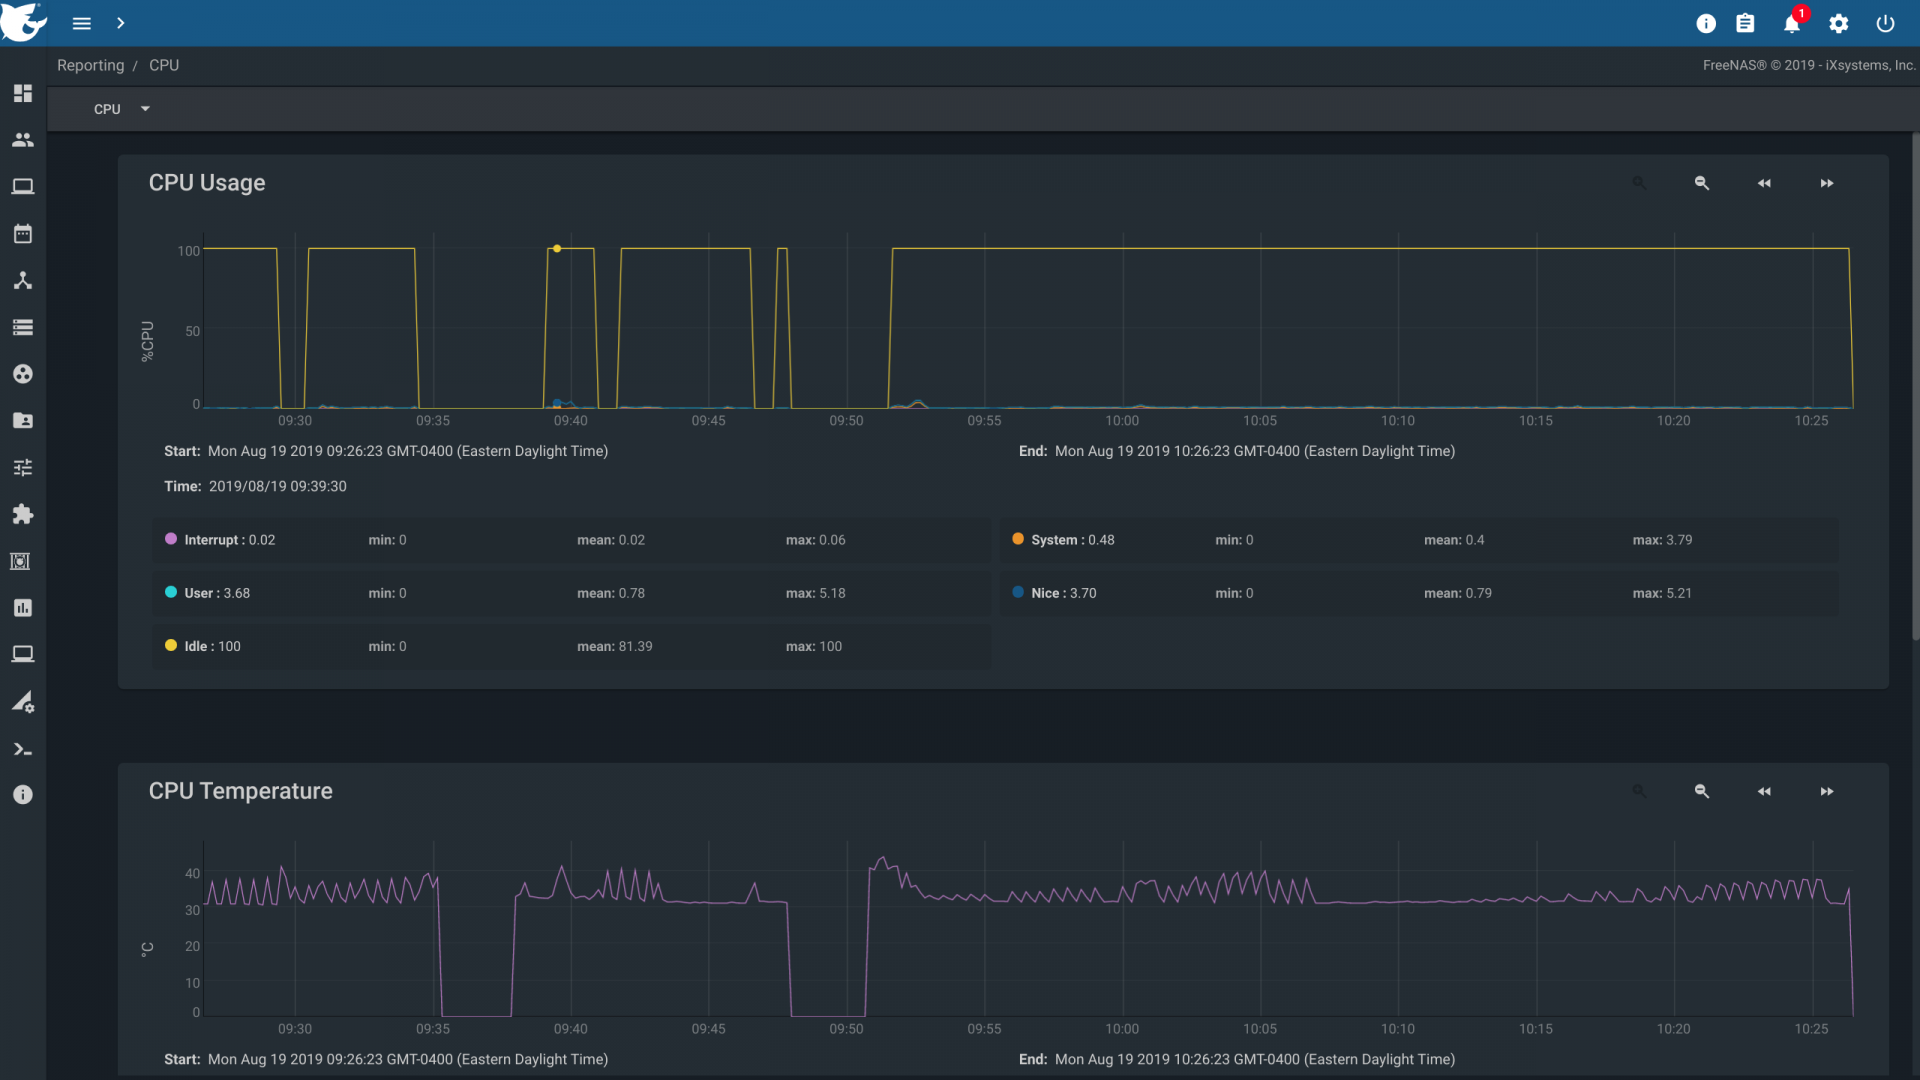
What’s new in Reports in 11.3:
  • Data is now prepared on the backend by the middleware and OS.
  • Any remaining data manipulation is done in a web worker, keeping expensive processing off of the main UI thread/context.
  • Removed SVG based charting library and replaced it with a canvas based library. The old library was creating in some instances over 200k DOM nodes for just 3 charts. The canvas based approach is GPU accelerated and avoids this problem completely.
  • Implemented virtual scroll/lazy loading to prevent overloading of the browser. This also eliminates the need for the pager.
  • Users can zoom by X or Y axis. A double click resets the zoom level.


Planned Reporting improvements for FreeNAS 12:
  • More performance optimizations.
  • Additional filtering options in the top bar.
  • Summary items for disks like hottest, fastest disks. This will give users a quick way to find which disks in the pool need to be investigated and what to filter for.
  • All charts on page will be synchronized and controlled via global controls.
  • Change chart types where appropriate. For example some stats would be better represented with a stacked or area chart type.

1566225805324.png
 

Attachments

  • 1566225951046.png
    1566225951046.png
    130.8 KB · Views: 946
  • 1566226045206.png
    1566226045206.png
    16.2 KB · Views: 835
  • 1566226063503.png
    1566226063503.png
    19.4 KB · Views: 1,046
  • 1566226115246.png
    1566226115246.png
    32.2 KB · Views: 989
Last edited:

Andreaux

Dabbler
Joined
Nov 17, 2019
Messages
20
I'm definitely missing drive temperature readings (be it historical or not) from the Dashboard :( Also, I just discovered that if you set the drives to go to Standby, you have no temperature logging at all... that is a big miss here.
 

appliance

Explorer
Joined
Nov 6, 2019
Messages
96
+1 temperature, +1 also for ups power consumption and a glitch: drive stats show nothing by default, even if a drive & metric is selected.
 

Damianos

iXsystems
iXsystems
Joined
Apr 17, 2017
Messages
44
UPDATE for 11.3
We managed to squeeze in a couple of planned 12 features into this 11.3 release.

  • Dashboard is now responsive
  • Middleware has added network traffic to real time stats.
With regards to the drive temperatures. I've made a ticket for the issue. I'll post my comment from the jira ticket here as a reminder for the rationale behind this decision as well as to summarize the options going forward.

Unlike the other live stats on the dashboard, disk temperatures are not available as real time events. Middleware team is also not planning on adding disk temperatures to the real time stats in the future and we don't want to reintroduce polling on the dashboard. That leaves us with the following options.
  1. Add disk temperatures to the disk details section and get the latest stat for that disk. (Would be static with no refreshes)
  2. Leave it as it is currently and direct users to the reports page where all such temperature information is still available.

With that said, if you'd like us to implement option 1, you can vote on this ticket at the link below. If we see significant interest in this, we'll take the ticket out of the backlog and resolve it for a future release.

https://jira.ixsystems.com/browse/NAS-103898
 

TimoJ

Dabbler
Joined
Jul 28, 2018
Messages
39
Why is everything so big and much of the screen space is wasted? I'm using a 2560x1440 32" monitor.
Dashboard could show much more in one view, there zooming to 65% makes the view much better. And in the Reports view the situation is even worse, there zooming to 40% is about the size I'd like to see and then reduce the space between the elements. Older UI's reports allowed to get much better overall view of several items at the same time.
 

Dariusz1989

Contributor
Joined
Aug 22, 2017
Messages
185
This dashboard update is terrible. The 11.2u7 was a lot more helpfull. It showed cirtical info & quick details upon clicking on hdd to get its temp/etc/etc. This new version is wasting a lot of space and offer very little information comparing to old one.

Not only that the reports/monitoring tab now gets stuck at the time you open it and no longer scroll to latest second of time.
The size/scale/gui is also terrible. I can only get 1-2 graphs visible, is this for 90 year olds who struggle to operate computers? Have a look at netData for more efficient GUI design, please.

Please rool back dash to 11.2u7 as this is big step backwards.
 

Dariusz1989

Contributor
Joined
Aug 22, 2017
Messages
185
I'm having a go at it.

This >
11.3
1581859210109.png

Is A LOT LESS helpfull than this >
11.2
1581859228856.png

Notice the size difference and content. The one above gives very little helpful informaton about the hardware/software. It also takes a lot more space.

Moving on, Network
11.3 gives me individual nics nad their up/down status, do we really need all of them? All I need is overview... say >
1581860241076.png


Moving on Pools
11.3 - large, mostly useless I dont know how many hdds there is etc/etc no temp info
1581860301033.png

11.2 small to the point. no BS
1581860269626.png


Generic overview >
11.3 - Kinda helpfull ? I mean I agree these are mostly good, except the wasted space and their size...
1581860433011.png


11.2 - 4 graphds, I have most of data I need about cpu/ram/temp. The blue boxes are a bit tall, could go shorter but other than that helpfull.

1581860367589.png


On top of that the "new monitoring" freezes at the time of refresh of website and no longer updates, I have to click arrows >> to go to latest second. > https://www.ixsystems.com/community/threads/freenas-11-3-metrics-no-longer-latest.82329/

+ a lot more changes that just are questionable...

Lets go to 11.2 with dash as the 11.3 is too big/useless.
 

rappel

Dabbler
Joined
Feb 12, 2020
Messages
10
Well, I've only been experimenting with FreeNAS for 3 weeks, just about to go live so decided to upgrade and learn the new version before I finally commit data.

Got to this page because I've lost the most important dashboard panel for me - disks and the disk temp. Appreciate that they might not be real time, but you had to click on each disk individually anyway, so that changed it.

My other observations echo what's already been said. Panels are way too big and sparse. Sure they are pretty but this is an overview admin screen it's there to give the important messages at a glance. Having to scroll up and down to see half the entries defeats the purpose for me.

Don't see the point of the pool panels. Don't see the point of the network panels. I have 2 pools and 5 interfaces, I could fit the same info for both pools and all five i/f in a grid on one panel for each type of info. OK, I'm not an advanced user, maybe someone else will get something out of these.

It feels like form over function is the main design criteria. Yes it looks gorgeous but that's really low down for me compared to the utility of the info presented and the direct responses available.

Sorry, this sounds really negative, still like the overall product.
 

networkgeek

Cadet
Joined
Mar 7, 2020
Messages
2
I am relatively new to the FreeNAS family as my first NAS was built less than a year ago with 11.2. I came here after upgrading to 11.3 (should have read the release notes) to provide my feedback on this new dashboard design.

In my opinion, it is a horrible replacement from the dashboard in 11.2.

I agree with a lot of what @Dariusz1989 has already said here. My biggest complaint with the new design is that for the Pool and NIC widgets, the important data points like NIC I/O and Pool available space are no longer called attention to. I really liked the pool disk space big numbers and the NIC I/O big numbers in the 11.2 dashboard compared to the replacement in 11.3 where it is the same size font as stuff I don't care about (caches, spares, logs). Especially with the pool widget... the huge picture of a hard drive platter with no useful information on top of it is a major waste of screen space. The system information widget... why make it provide less information than the old one? That alone is a really dumb change to make and makes me question the motives behind the redesign.

Please revert to the dashboard in 11.2 or at least offer users a choice to toggle between the 11.2 dashboard and the 11.3 dashboard.

Thanks,

Geoff
 

bitola1970

Dabbler
Joined
Aug 7, 2016
Messages
14
yep, im getting blank dashboard after updating to FreeNAS-11.3-U3.2. i have had many years of stable system until 11.3. did few reboots etc and no change. Hope the recent issues is not an indication of times to come with truenas core.

Does anyone know how to resolve the problem. i supose i can downgrade back 11.2xxx but want to avoid that.
 

sretalla

Powered by Neutrality
Moderator
Joined
Jan 1, 2016
Messages
9,702
has this happen to anyone in FreeNAS-11.3-U3.1 I've tried to restart it
yes to me as well. How can I fix it?
Same for me. The dashboard is now completely blank.
yep, im getting blank dashboard after updating to FreeNAS-11.3-U3.2
Have you tried to clear the browser cache? This is usually a problem following updates and is solved easily with shift-refresh in the browser or clearing the browser cache in total.
 

bitola1970

Dabbler
Joined
Aug 7, 2016
Messages
14
yes i have. tried on a few different browsers as well and also same happens on a few of my laptops, my PC and my phone.
 

Samuel Tai

Never underestimate your own stupidity
Moderator
Joined
Apr 24, 2020
Messages
5,398
By any chance are you logging in over Wi-Fi or over a wired net? There’ve been some reports of UI anomalies like this over Wi-Fi, but not over wired nets.
 

bitola1970

Dabbler
Joined
Aug 7, 2016
Messages
14
thanks for your reply. yeah, i did try on my wired PC and no change. i will try a downgrade and see if that works and then re-upgrade to the current release.

have also noticed my server rebooting randomly. ok time to go back to the previous release and see what happens.


By any chance are you logging in over Wi-Fi or over a wired net? There’ve been some reports of UI anomalies like this over Wi-Fi, but not over wired nets.
 
Last edited:

bitola1970

Dabbler
Joined
Aug 7, 2016
Messages
14
i rebooted to my last woking release (11.3-U1) and all good with dashboard loading properly. I then upgraded again to current release (11.3-U3.2) and its working fine now. most likley an issue during the first upgrade that was now fixed.

thanks for your reply. yeah, i did try on my wired PC and no change. i will try a downgrade and see if that works and then re-upgrade to the current release.

have also noticed my server rebooting randomly. ok time to go back to the previous release and see what happens.
 
Top