Major drop-off in read/write speed after 3.5 yrs

VictorR

Contributor
Joined
Dec 9, 2015
Messages
143
FreeNAS-11.2-U5
(Build Date: Jun 24, 2019 18:41)

45 Drives Storinator Q30 NAS:
SuperMicro X10DRL motherboard (Firmware Revision: 03.80 02/14/2019, BIOS Version: 3.1c 04/27/2019, Redfish Version : 1.0.1)
Dual Xeon E5-2620 v3 @ 2.4GHz
256GB RAM
2x 125GB SSD boot drives
3 x dual Intel X540T2BLK 10Gbe NICs
30 x 4TB WD Re drives (actually 25 Red, 5 Gold replacements)

Netgear XS728T 10 Gbe 24-port managed switch

Sonnet Twin 10G Thunderbolt to ethernet converters
Test network with only the NAS and single 27” iMac client (1TB SSD)

After a couple of years, I finally got a chance to wipe clean and reconfigure our NAS pools. We’d been running in a 3 x 10 RAIDZ2 pool for 2K/4K raw video editing on to six 2013 Mac Pros. We got smooth throughput to all stations with multiple simultaneous raw 4k streams, each, When the NAS was <30% full, speeds of 700-800MB/s both ways were not unusual. At 50% full, it was still possible to get steady 400-500MB/s speed.
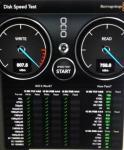


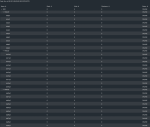
2RjXHhx.png

I deleted the pool to get rid of the 80TB of backed-up data, and recreated a 3 x10 pool with compression turned off. Nothing has popped up in SMART tests.
But, there is significant drop-off in read/write performance. So, I upgraded to FreeNAS-11.2-U5, flashed in latest BIOS/Firmware/IPMI. Still slower, I replaced one of the 8GB RAM chips, that was throwing up errors. But, that seems to have made no difference.

RAIDZ2 (3 x 10) from Jan 2016.. for comparison

[root@Q30] ~# dd if=/dev/zero of=/mnt/Q30/test.bin bs=2048k count=1024k
1048576+0 records in
1048576+0 records out
2199023255552 bytes transferred in 1098.190928 secs (2,002,405,228 bytes/sec) [commas added for ease of reading]

[root@q30 /mnt/Q30]# dd if=test.bin of=/dev/null bs=2048k count=1024k
1048576+0 records in
1048576+0 records out
2199023255552 bytes transferred in 1392.109668 secs (1,579,633,635 bytes/sec)

Jul 28, 2019:

root@freenas:~ # dd if=/dev/zero of=/mnt/Q30/Test/test.bin bs=2048k count=1024k
1048576+0 records in
1048576+0 records out
2199023255552 bytes transferred in 1593.191745 secs (1,380,262,773 bytes/sec)

root@freenas: dd if=/mnt/Q30/Test/test.bin of=/dev/null bs=2048k count=1024k
1048576+0 records in
1048576+0 records out
2199023255552 bytes transferred in 3142.254662 secs (699,823,373 bytes/sec)

I'd expect some minor degradation in speed. But, this is pretty big.
Can someone recommend other tests to run?
 

Attachments

  • Pool.png
    Pool.png
    1.2 MB · Views: 294
Last edited:

VictorR

Contributor
Joined
Dec 9, 2015
Messages
143
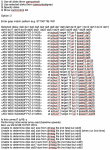
I don't know if there is a big difference between these two Iozone tests:

root@q30 /mnt/Q30]# iozone -t 1 -i 0 -i 1 -r 1M -s 50G
Iozone: Performance Test of File I/O
Version $Revision: 3.420 $
Compiled for 64 bit mode.
Build: freebsd

Run began: Sat Jan 16 17:23:11 2016

Record Size 1024 KB
File size set to 52428800 KB
Command line used: iozone -t 1 -i 0 -i 1 -r 1M -s 50G
Output is in Kbytes/sec
Time Resolution = 0.000001 seconds.
Processor cache size set to 1024 Kbytes.
Processor cache line size set to 32 bytes.
File stride size set to 17 * record size.
Throughput test with 1 process
Each process writes a 52428800 Kbyte file in 1024 Kbyte records

Children see throughput for 1 initial writers = 2053304.25 KB/sec
Parent sees throughput for 1 initial writers = 1873862.41 KB/sec
Min throughput per process = 2053304.25 KB/sec
Max throughput per process = 2053304.25 KB/sec
Avg throughput per process = 2053304.25 KB/sec
Min xfer = 52428800.00 KB

Children see throughput for 1 rewriters = 2001599.25 KB/sec
Parent sees throughput for 1 rewriters = 1840786.42 KB/sec
Min throughput per process = 2001599.25 KB/sec
Max throughput per process = 2001599.25 KB/sec
Avg throughput per process = 2001599.25 KB/sec
Min xfer = 52428800.00 KB

Children see throughput for 1 readers = 4975211.50 KB/sec
Parent sees throughput for 1 readers = 4973957.49 KB/sec
Min throughput per process = 4975211.50 KB/sec
Max throughput per process = 4975211.50 KB/sec
Avg throughput per process = 4975211.50 KB/sec
Min xfer = 52428800.00 KB

Children see throughput for 1 re-readers = 5235301.00 KB/sec
Parent sees throughput for 1 re-readers = 5234446.36 KB/sec
Min throughput per process = 5235301.00 KB/sec
Max throughput per process = 5235301.00 KB/sec
Avg throughput per process = 5235301.00 KB/sec
Min xfer = 52428800.00 KB
iozone test complete.

root@freenas:~ # iozone -t 1 -i 0 -i 1 -r 1M -s 50G
Iozone: Performance Test of File I/O
Version $Revision: 3.457 $
Compiled for 64 bit mode.
Build: freebsd

Run began: Sat Jun 15 23:20:25 2019

Record Size 1024 kB
File size set to 52428800 kB
Command line used: iozone -t 1 -i 0 -i 1 -r 1M -s 50G
Output is in kBytes/sec
Time Resolution = 0.000001 seconds.
Processor cache size set to 1024 kBytes.
Processor cache line size set to 32 bytes.
File stride size set to 17 * record size.
Throughput test with 1 process
Each process writes a 52428800 kByte file in 1024 kByte records

Children see throughput for 1 initial writers = 3520770.00 kB/sec
Parent sees throughput for 1 initial writers = 3509231.52 kB/sec
Min throughput per process = 3520770.00 kB/sec
Max throughput per process = 3520770.00 kB/sec
Avg throughput per process = 3520770.00 kB/sec
Min xfer = 52428800.00 kB

Children see throughput for 1 rewriters = 3508749.00 kB/sec
Parent sees throughput for 1 rewriters = 3500405.48 kB/sec
Min throughput per process = 3508749.00 kB/sec
Max throughput per process = 3508749.00 kB/sec
Avg throughput per process = 3508749.00 kB/sec
Min xfer = 52428800.00 kB

Children see throughput for 1 readers = 2132113.50 kB/sec
Parent sees throughput for 1 readers = 2132005.52 kB/sec
Min throughput per process = 2132113.50 kB/sec
Max throughput per process = 2132113.50 kB/sec
Avg throughput per process = 2132113.50 kB/sec
Min xfer = 52428800.00 kB

Children see throughput for 1 re-readers = 2960680.25 kB/sec
Parent sees throughput for 1 re-readers = 2960483.63 kB/sec
Min throughput per process = 2960680.25 kB/sec
Max throughput per process = 2960680.25 kB/sec
Avg throughput per process = 2960680.25 kB/sec
Min xfer = 52428800.00 kB
iozone test complete.
 

Chris Moore

Hall of Famer
Joined
May 2, 2015
Messages
10,080

VictorR

Contributor
Joined
Dec 9, 2015
Messages
143
Thanks, that is pretty slick!
Now that you mention it, it seems so obvious that one or more dogs could be dragging the whole thing down. I remember seeing several WD Reds being marked as "old" when I last looked at one of the test outputs a year ago.
I'd say ~8 of the 30 have been replaced because of bad sectors, etc. About a year ago, they started sending Golds as replacements. Last time I looked at Backblaze's drive data, Reds had an unusually high failure rate

I'm tempted to drive back to the office, right now. Just so I can have some data and send the bad ones back, tomorrow.
 
Last edited:

VictorR

Contributor
Joined
Dec 9, 2015
Messages
143
I couldn't resist the urge. Drove the 40 mins back and got it started. It's 2am, now.

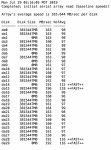
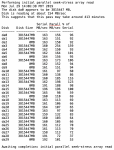
Performing initial serial array read (baseline speeds)
Mon Jul 29 02:08:18 PDT 2019

Looks like the whole test could take 6-12 hours to run
Since there's nothing on this NAS, I'll check on it around noon tomorrow
 
Last edited:

jgreco

Resident Grinch
Joined
May 29, 2011
Messages
18,680
Also, how full is the pool?

ZFS speeds will tend to decline as fragmentation increases. Some people have experienced this as "hitting a wall" where performance seems to tank. This has to do with the amount of contiguous free space that's available, and the activity patterns (particularly write) that happen on the pool.

I've talked about fragmentation in at least hundreds of posts over the years so there's lots of information floating around, and if this seems like it might fit, we can discuss the possibility further.
 

Chris Moore

Hall of Famer
Joined
May 2, 2015
Messages
10,080
I had, at work, a pool with eight vdevs of eight drives (64 drives) that was behaving slow. I ultimately needed to replace twelve of the drives that were delivering poor performance.
Not all drive failures are clearly seen. We sometimes need to be a detective and look for the clues.
 

VictorR

Contributor
Joined
Dec 9, 2015
Messages
143
Also, how full is the pool?

Brand new 80TB pool with zero data. Nothing else on the NAS

Prior to creating this new pool, I deleted one of the same size that was >85% full. The fragmentation from that one wouldn’t still affect things, would it?
 

Chris Moore

Hall of Famer
Joined
May 2, 2015
Messages
10,080
Prior to creating this new pool, I deleted one of the same size that was >85% full. The fragmentation from that one wouldn’t still affect things, would it?
When the old pool was deleted, the drives would have had their partitions deleted and new partitions would have been created for the new pool. At least, that is how it should work. The new pool should be treating the drives as blank, so any performance hit would be on account of poor drive performance.
 

jgreco

Resident Grinch
Joined
May 29, 2011
Messages
18,680
Brand new 80TB pool with zero data. Nothing else on the NAS

Prior to creating this new pool, I deleted one of the same size that was >85% full. The fragmentation from that one wouldn’t still affect things, would it?

Certainly not if you created a new pool. I'm thinking @Chris Moore is probably right.
 

VictorR

Contributor
Joined
Dec 9, 2015
Messages
143
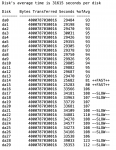
Ok, 18 hrs in and it is still not done. Have no idea how much farther it as to go. But, here is the output, so far, in pdf document to preserve table formatting. I'll check again, 12 hours from now

T1.png T2.png T3.png T4.png T5.png
 

Attachments

  • Q30 Disk Test.pdf
    38.7 KB · Views: 432
Last edited:

VictorR

Contributor
Joined
Dec 9, 2015
Messages
143
Argh! SSH client was accidentally disconnected. Think it likely killed the script
Just restarted it. Will pass on full test results Wednesday morning(hopefully)
 

Chris Moore

Hall of Famer
Joined
May 2, 2015
Messages
10,080
Argh! SSH client was accidentally disconnected. Think it likely killed the script
Just restarted it. Will pass on full test results Wednesday morning(hopefully)
Just from these preliminary numbers, there are some very slow drives. They are probably suffering some mechanical problem. Can we see results of long SMART tests?
 
Joined
Jul 3, 2015
Messages
926
Argh! SSH client was accidentally disconnected. Think it likely killed the script
Just restarted it. Will pass on full test results Wednesday morning(hopefully)
tmux is your friend here
 

VictorR

Contributor
Joined
Dec 9, 2015
Messages
143
Last edited:
Joined
Jul 3, 2015
Messages
926

VictorR

Contributor
Joined
Dec 9, 2015
Messages
143
Joined
Jul 3, 2015
Messages
926
The old fashioned way - copy & paste into a desktop word processor, then saved/exported it as a .pdf
Ah ok thanks, thought you had a clever trick then ;)
 

VictorR

Contributor
Joined
Dec 9, 2015
Messages
143
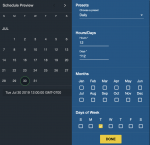
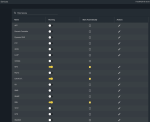
Well, I ran a Long Test at 1am, didn't receive an email
So I check SERVICES in GUI and it is running with my email entered (I get other system notices via email)
TASKS>SMART Tests>Long Test calendar showed it set for 01 hours.
But, when I check results for a drive, here is what shows
smart1.png

So, I set it, again, to run at noon today (5 mins from now)

SMART.png

Tasks.png

At 12:16pm, I checked progress("smartctl -a /dev/da0") on the first disk listed in Tasks>SMART Tests - da0
And, it shows no progress for a test running, and no results, if it finished

progress2.png

progress3.png

I am stumped on this
 
Last edited:
Top