kernal swapin

Joined
May 20, 2016
Messages
28
Hello all,

I have a very unresponsive freenas (ixsystem mini xl ).

When I run a top -S I can see that the kernel is in a state of swapin and using most of the available cpus, sometimes, nothing will be left for the rest of the machine.

Code:
last pid: 23132;  load averages:  7.36,  7.19,  7.06                                                                                                                                  up 0+02:44:10  12:02:10
114 processes: 5 running, 108 sleeping, 1 waiting
CPU:  4.5% user,  0.0% nice, 78.0% system,  0.6% interrupt, 16.9% idle
Mem: 13M Active, 242M Inact, 1148M Laundry, 28G Wired, 2171M Free
ARC: 22G Total, 3298M MFU, 13G MRU, 5182M Anon, 361M Header, 360M Other
     17G Compressed, 144G Uncompressed, 8.64:1 Ratio
Swap: 2048M Total, 2048M Free

  PID USERNAME    THR PRI NICE   SIZE    RES STATE   C   TIME    WCPU COMMAND
    0 root        671 -16    -     0K 10736K swapin  4 898:08 619.59% kernel
   11 root          8 155 ki31     0K   128K RUN     0 301:04 134.54% idle
8471 sauvegarde    1  33    0 16004K 11764K CPU3    3  23:43  23.65% rsync
8467 sauvegarde    1   4    0 12916K  9248K RUN     3   8:44   7.94% sshd
  240 root         22  30    0   268M   206M kqread  4   2:42   7.85% python3.6
   12 root         48 -56    -     0K   768K WAIT   -1  14:44   6.23% intr
3351 root         11  20    0 97648K 52208K nanslp  4   1:37   4.63% collectd
3326 root         15  20    0   176M   137M umtxn   3   0:11   1.69% uwsgi-3.6
3005 root          8  20    0 35768K 12228K select  3   0:18   1.27% rrdcached
    4 root          3 -16    -     0K    48K RUN     3   2:09   0.84% cam
   16 root          1 -16    -     0K    16K -       4   0:29   0.18% rand_harvestq
23039 simonpie      1  20    0  7940K  3592K CPU6    6   0:00   0.18% top


There is enough ram in the system and nothing much is happening. This situation started three days ago. I upgraded the OS yesterday to the latest FreeNAS-11.2-U3. Still the same problem.
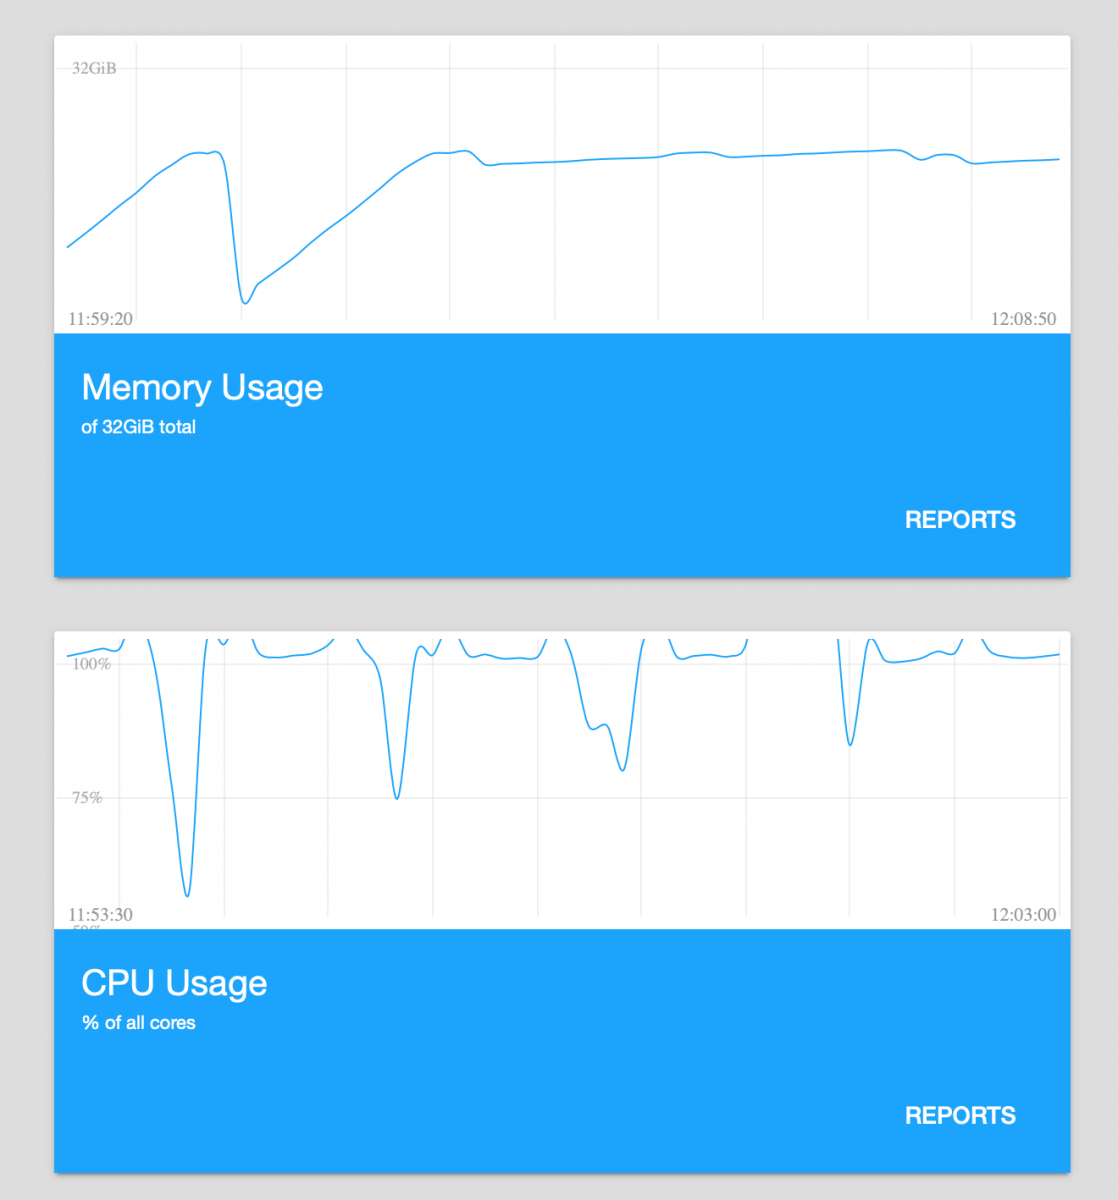
Capture d’écran, le 2019-04-03 à 12.09.35.png


I would appreciate any help to diagnose the culprit.

Thank you,
 

mav@

iXsystems
iXsystems
Joined
Sep 29, 2011
Messages
1,428
When running `top` with `-S`, add also `-Hz` there. Otherwise looking on thread status for multi-threadede application (here kernel) makes no any sense. I am not sure what that "swapin" actually means, but as I see your system has no active swap. It is CPU you have busy with something.
 
Joined
May 20, 2016
Messages
28
Thank you, I used your suggestion see the output below :

I had a disk that might had been faulty as running smartctl -a /dev/mydisk took a few second to return. I changed it, I thought everything was back to normal, but alas, the problem came back.

Code:
last pid:   697;  load averages:  7.64,  7.86,  8.34                                                                                                                                     up 1+23:08:58  10:14:48
140 processes: 4 running, 135 sleeping, 1 waiting
CPU:  4.7% user,  0.0% nice, 76.0% system,  1.4% interrupt, 17.8% idle
Mem: 148M Active, 1362M Inact, 29G Wired, 998M Free
ARC: 24G Total, 149M MFU, 18G MRU, 4786M Anon, 231M Header, 795M Other
     18G Compressed, 57G Uncompressed, 3.16:1 Ratio
Swap: 2048M Total, 2048M Free

  PID USERNAME    THR PRI NICE   SIZE    RES STATE   C   TIME    WCPU COMMAND
    0 root        670 -16    -     0K 10720K swapin  0 136.8H 592.50% kernel
   11 root          8 155 ki31     0K   128K RUN     0 214.1H 142.96% idle
   12 root         48 -56    -     0K   768K WAIT   -1 246:56   9.78% intr
61001 sauvegarde    1  23    0 16004K 11832K CPU3    3  22:21   7.05% rsync
59896 sauvegarde    1  23    0 11908K  7084K dp->dp  6  23:12   6.87% rsync
60056 sauvegarde    1  23    0 18052K 12344K dp->dp  6  22:59   5.92% rsync
53296 sauvegarde    1  25    0 12916K  8868K select  4  58:07   5.79% sshd
54550 sauvegarde    1  23    0 18052K 14164K dp->dp  3  29:45   5.66% rsync
53704 sauvegarde    1  23    0 99972K 89980K dp->dp  3  29:02   3.80% rsync
52063 sauvegarde    1  24    0 30340K 25080K dp->dp  2  32:05   2.99% rsync
51980 sauvegarde    1  23    0 12916K  8728K select  0  29:02   2.42% sshd
59878 sauvegarde    1  20    0 12916K  9024K select  6   9:51   2.15% sshd
60989 sauvegarde    1   4    0 12916K  9120K RUN     3   6:42   1.53% sshd


Code:
last pid:   697;  load averages:  7.39,  7.79,  8.31                                                                                                                                     up 1+23:09:05  10:14:55
965 processes: 20 running, 897 sleeping, 48 waiting
CPU:  4.3% user,  0.0% nice, 76.0% system,  1.7% interrupt, 18.1% idle
Mem: 150M Active, 1361M Inact, 29G Wired, 997M Free
ARC: 24G Total, 149M MFU, 18G MRU, 5010M Anon, 231M Header, 795M Other
     18G Compressed, 58G Uncompressed, 3.13:1 Ratio
Swap: 2048M Total, 2048M Free

  PID USERNAME   PRI NICE   SIZE    RES STATE   C   TIME    WCPU COMMAND
    0 root       -12    -     0K 10720K CPU3    3  22.7H 100.00% kernel{zio_write_issue_4}
    0 root       -12    -     0K 10720K CPU2    2  22.7H 100.00% kernel{zio_write_issue_5}
    0 root       -12    -     0K 10720K CPU4    4  22.7H  99.32% kernel{zio_write_issue_2}
    0 root       -12    -     0K 10720K CPU0    0  22.7H  98.86% kernel{zio_write_issue_1}
    0 root       -12    -     0K 10720K CPU1    1  22.7H  93.34% kernel{zio_write_issue_0}
    0 root       -12    -     0K 10720K CPU5    5  22.7H  91.51% kernel{zio_write_issue_3}
   11 root       155 ki31     0K   128K RUN     7  26.3H  38.27% idle{idle: cpu7}
   11 root       155 ki31     0K   128K RUN     6  29.7H  37.66% idle{idle: cpu6}
   11 root       155 ki31     0K   128K RUN     3  30.0H  25.94% idle{idle: cpu3}
   11 root       155 ki31     0K   128K RUN     4  27.4H  16.56% idle{idle: cpu4}
53296 sauvegarde  27    0 12916K  8868K select  0  58:08  13.34% sshd
   11 root       155 ki31     0K   128K RUN     2  25.0H   9.54% idle{idle: cpu2}
   11 root       155 ki31     0K   128K RUN     0  26.3H   9.23% idle{idle: cpu0}
   12 root       -92    -     0K   768K WAIT    7  42:37   7.66% intr{irq263: ix0:q7


As we can see, swapin is not a state for a threads, but those kernel{zio_write_issue_X} sure do use a lot of cpu. During my rebuild, one other disk reported unreadable sectors. But its smartctl returns in normal time. I will change it today to see if it helps :

Code:
> sudo smartctl -a /dev/ada4
smartctl 6.6 2017-11-05 r4594 [FreeBSD 11.2-STABLE amd64] (local build)
Copyright (C) 2002-17, Bruce Allen, Christian Franke, www.smartmontools.org

=== START OF INFORMATION SECTION ===
Model Family:     Western Digital Red Pro
Device Model:     WDC WD4001FFSX-68JNUN0
Serial Number:    WD-WCC136HF8YCR
LU WWN Device Id: 5 0014ee 2613ae22f
Firmware Version: 81.00A81
User Capacity:    4,000,787,030,016 bytes [4.00 TB]
Sector Sizes:     512 bytes logical, 4096 bytes physical
Rotation Rate:    7200 rpm
Device is:        In smartctl database [for details use: -P show]
ATA Version is:   ATA8-ACS (minor revision not indicated)
SATA Version is:  SATA 3.0, 6.0 Gb/s (current: 3.0 Gb/s)
Local Time is:    Sun Apr  7 10:25:22 2019 EDT
SMART support is: Available - device has SMART capability.
SMART support is: Enabled

=== START OF READ SMART DATA SECTION ===
SMART overall-health self-assessment test result: PASSED

General SMART Values:
Offline data collection status:  (0x00)    Offline data collection activity
                    was never started.
                    Auto Offline Data Collection: Disabled.
Self-test execution status:      ( 241)    Self-test routine in progress...
                    10% of test remaining.
Total time to complete Offline
data collection:         (41760) seconds.
Offline data collection
capabilities:              (0x7b) SMART execute Offline immediate.
                    Auto Offline data collection on/off support.
                    Suspend Offline collection upon new
                    command.
                    Offline surface scan supported.
                    Self-test supported.
                    Conveyance Self-test supported.
                    Selective Self-test supported.
SMART capabilities:            (0x0003)    Saves SMART data before entering
                    power-saving mode.
                    Supports SMART auto save timer.
Error logging capability:        (0x01)    Error logging supported.
                    General Purpose Logging supported.
Short self-test routine
recommended polling time:      (   2) minutes.
Extended self-test routine
recommended polling time:      ( 451) minutes.
Conveyance self-test routine
recommended polling time:      (   5) minutes.
SCT capabilities:            (0x70bd)    SCT Status supported.
                    SCT Error Recovery Control supported.
                    SCT Feature Control supported.
                    SCT Data Table supported.

SMART Attributes Data Structure revision number: 16
Vendor Specific SMART Attributes with Thresholds:
ID# ATTRIBUTE_NAME          FLAG     VALUE WORST THRESH TYPE      UPDATED  WHEN_FAILED RAW_VALUE
  1 Raw_Read_Error_Rate     0x002f   200   199   051    Pre-fail  Always       -       0
  3 Spin_Up_Time            0x0027   174   139   021    Pre-fail  Always       -       10300
  4 Start_Stop_Count        0x0032   100   100   000    Old_age   Always       -       40
  5 Reallocated_Sector_Ct   0x0033   200   200   140    Pre-fail  Always       -       0
  7 Seek_Error_Rate         0x002e   200   200   000    Old_age   Always       -       0
  9 Power_On_Hours          0x0032   063   063   000    Old_age   Always       -       27259
 10 Spin_Retry_Count        0x0032   100   253   000    Old_age   Always       -       0
 11 Calibration_Retry_Count 0x0032   100   253   000    Old_age   Always       -       0
 12 Power_Cycle_Count       0x0032   100   100   000    Old_age   Always       -       32
 16 Unknown_Attribute       0x0022   030   170   000    Old_age   Always       -       528893358566
183 Runtime_Bad_Block       0x0032   100   100   000    Old_age   Always       -       0
192 Power-Off_Retract_Count 0x0032   200   200   000    Old_age   Always       -       27
193 Load_Cycle_Count        0x0032   194   194   000    Old_age   Always       -       18373
194 Temperature_Celsius     0x0022   111   052   000    Old_age   Always       -       41
196 Reallocated_Event_Count 0x0032   200   200   000    Old_age   Always       -       0
197 Current_Pending_Sector  0x0032   200   200   000    Old_age   Always       -       0
198 Offline_Uncorrectable   0x0030   100   253   000    Old_age   Offline      -       0
199 UDMA_CRC_Error_Count    0x0032   200   200   000    Old_age   Always       -       0
200 Multi_Zone_Error_Rate   0x0008   200   200   000    Old_age   Offline      -       1

SMART Error Log Version: 1
No Errors Logged

SMART Self-test log structure revision number 1
Num  Test_Description    Status                  Remaining  LifeTime(hours)  LBA_of_first_error
# 1  Extended offline    Completed: read failure       10%     27248         3519051904
# 2  Extended offline    Completed: read failure       10%     27201         3519051904
# 3  Extended offline    Completed without error       00%     27038         -
# 4  Extended offline    Completed without error       00%     26368         -
# 5  Extended offline    Completed without error       00%     25625         -
# 6  Extended offline    Completed without error       00%     24881         -
# 7  Extended offline    Completed without error       00%     24162         -
# 8  Extended offline    Completed without error       00%     23418         -
# 9  Extended offline    Completed without error       00%     22700         -
#10  Extended offline    Completed without error       00%     21956         -
#11  Extended offline    Completed without error       00%     21213         -
#12  Extended offline    Completed without error       00%     20493         -
#13  Extended offline    Completed without error       00%     19818         -
#14  Extended offline    Completed without error       00%     19794         -
#15  Extended offline    Completed without error       00%     19770         -
#16  Extended offline    Interrupted (host reset)      20%     19744         -
#17  Extended offline    Completed without error       00%     19722         -
#18  Extended offline    Completed without error       00%     19698         -
#19  Extended offline    Completed without error       00%     19674         -
#20  Extended offline    Completed without error       00%     19650         -
#21  Extended offline    Completed without error       00%     19626         -

SMART Selective self-test log data structure revision number 1
 SPAN  MIN_LBA  MAX_LBA  CURRENT_TEST_STATUS
    1        0        0  Not_testing
    2        0        0  Not_testing
    3        0        0  Not_testing
    4        0        0  Not_testing
    5        0        0  Not_testing
Selective self-test flags (0x0):
  After scanning selected spans, do NOT read-scan remainder of disk.
If Selective self-test is pending on power-up, resume after 0 minute delay.

> 
 
Joined
May 20, 2016
Messages
28
Hello again,

I changed the defective drive today. Everything looked normal, the system was resilvering without using too much cpu and then nightly backup started. That's when the swapin process made its appearance. Again, a lot of zio_write_issue_X

Code:
last pid: 69843;  load averages:  7.34,  7.75,  8.13                                                                                                                                     up 0+10:24:35  22:24:08
942 processes: 16 running, 878 sleeping, 48 waiting
CPU:  2.0% user,  0.0% nice, 75.6% system,  0.9% interrupt, 21.5% idle
Mem: 145M Active, 1224M Inact, 29G Wired, 1067M Free
ARC: 24G Total, 6581M MFU, 11G MRU, 5708M Anon, 533M Header, 143M Other
     19G Compressed, 99G Uncompressed, 5.32:1 Ratio
Swap: 2048M Total, 2048M Free

  PID USERNAME   PRI NICE   SIZE    RES STATE   C   TIME    WCPU COMMAND
    0 root       -12    -     0K 10736K CPU2    2  24:56 100.00% kernel{zio_write_issue_5}
    0 root       -12    -     0K 10736K CPU1    1  24:55  99.24% kernel{zio_write_issue_4}
    0 root       -12    -     0K 10736K CPU4    4  24:55  98.57% kernel{zio_write_issue_0}
    0 root       -12    -     0K 10736K CPU0    0  24:56  97.61% kernel{zio_write_issue_2}
    0 root       -12    -     0K 10736K CPU5    5  24:55  95.61% kernel{zio_write_issue_3}
    0 root       -12    -     0K 10736K CPU7    7  24:55  92.90% kernel{zio_write_issue_1}
66151 sauvegarde  26    0 13956K  9336K dp->dp  6  10:41   9.35% rsync
66104 sauvegarde  23    0 12916K  9140K select  6   7:59   5.77% sshd
   12 root       -92    -     0K   768K WAIT    3   3:32   2.52% intr{irq259: ix0:q3}
   12 root       -60    -     0K   768K WAIT    3   4:32   0.74% intr{swi4: clock (0)}
69699 simonpie    20    0 14084K  6896K CPU3    3   0:00   0.38% top


Resilvering should be done overnight. Will see tomorrow. But I fear there is a problem with the latest version of freenas.
 

mav@

iXsystems
iXsystems
Joined
Sep 29, 2011
Messages
1,428
zio_write_issue_N threads are doing data compression on write, so some time spent there is expected, if you have compression enabled. Haven't you changed compression algorithm from default lz4 to gzip by chance? I see you have rsync running also, so may be this is just a valid workload?
 
Joined
May 20, 2016
Messages
28
Good catch. For some reason, the main pool was on gzip-9. I dont remember changing it, but I dont see how cannnot be responsible for that. I changed it back to lz4. I still wonder, everything was fine for mounts and suddently, Boum, Super high load.

Yes, the bunch of rsync are normal, they are the nightly backup that just are not finished because of the high load.

I shall report back tomorow if things have calmed down. But I can already report that the Swapin process is not using a much cpu. But load went higher, probably because all the rsyncs get more time. Normally they run at night.
 

Ericloewe

Server Wrangler
Moderator
Joined
Feb 15, 2014
Messages
20,194
Top