"Nice" CPU usage...Does FreeNAS throttle CPU usage?

Status
Not open for further replies.

underpickled

Contributor
Joined
Oct 1, 2013
Messages
167
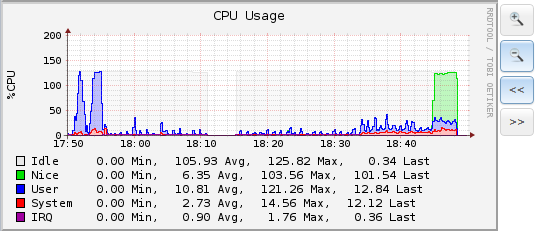
So... finally turned FreeNAS into a Subsonic server thanks to a super helpful thread on here. It led me to notice that while loading down the system (transcoding and streaming 2 full HD streams), I notice that the CPU usage seems to top out at the top of the grayish box (the idle max, by the looks of it). Now I seem to have full usage by the "nice" category, but it seems to be limited to around 125%.

What is the "nice" category, and why is it that CPU usage seems limited to 125%?
cpu_usage.png


I should mention that I have an i3-4130... 2 physical cores, 4 soft cores... so 200% makes sense as a total.
 

Dusan

Guru
Joined
Jan 29, 2013
Messages
1,165
What is the "nice" category, and why is it that CPU usage seems limited to 125%?
nice: Both the User and Nice values show CPU consumed by userland processes. The User value shows normal priority processes, while the Nice value is for processes running with lower priority (higher nice value). What you see is that you have a running process that consumes lot of CPU capacity, but runs at a lower priority to decrease its impact on the system responsiveness (the process is being nice :) ). If you open the Display system processes window in the GUI (which shows output of the top command) you can easily identify the process -- it will have a non zero value in the NICE column.
125%: The graph is actually mislabeled. The Y axis is not in %CPU but in "time units of scheduling" and the "grayish box" is actually the Idle time displayed on top of the other graphs. You can run sysctl kern.clockrate to find the maximum total value (it's the stathz value; the graph may not always add up exactly to that value, see here for more details: https://collectd.org/wiki/index.php/Plugin:CPU). In my case the output is: "kern.clockrate: { hz = 1000, tick = 1000, profhz = 8128, stathz = 127 }".
To sum it up: The graph shows that your CPU is maxed. You can also see it in the Display system processes window -- the third line shows CPU usage in percents.
 

underpickled

Contributor
Joined
Oct 1, 2013
Messages
167
nice: Both the User and Nice values show CPU consumed by userland processes. The User value shows normal priority processes, while the Nice value is for processes running with lower priority (higher nice value). What you see is that you have a running process that consumes lot of CPU capacity, but runs at a lower priority to decrease its impact on the system responsiveness (the process is being nice :) ). If you open the Display system processes window in the GUI (which shows output of the top command) you can easily identify the process -- it will have a non zero value in the NICE column.
125%: The graph is actually mislabeled. The Y axis is not in %CPU but in "time units of scheduling" and the "grayish box" is actually the Idle time displayed on top of the other graphs. You can run sysctl kern.clockrate to find the maximum total value (it's the stathz value; the graph may not always add up exactly to that value, see here for more details: https://collectd.org/wiki/index.php/Plugin:CPU). In my case the output is: "kern.clockrate: { hz = 1000, tick = 1000, profhz = 8128, stathz = 127 }".
To sum it up: The graph shows that your CPU is maxed. You can also see it in the Display system processes window -- the third line shows CPU usage in percents.

Thanks for the thorough response. Looks like getting an i3 wasn't a waste after all!
 

Dusan

Guru
Joined
Jan 29, 2013
Messages
1,165
I just noticed that the CPU graph shows data for only one logical core (the first one). I have a Xeon with 4 physical cores (8 logical). I started a process that consumes all CPU it can get. top shows that it is indeed consuming 100% of one (logical) core, but the total CPU usage is only 12.5% (100/8). I can also see the OS slowly rotating the process across cores. However, the CPU graph only shows a spike now and then (when the process is running on core 0).
 

underpickled

Contributor
Joined
Oct 1, 2013
Messages
167
I just noticed that the CPU graph shows data for only one logical core (the first one). I have a Xeon with 4 physical cores (8 logical). I started a process that consumes all CPU it can get. top shows that it is indeed consuming 100% of one (logical) core, but the total CPU usage is only 12.5% (100/8). I can also see the OS slowly rotating the process across cores. However, the CPU graph only shows a spike now and then (when the process is running on core 0).
Interesting... Looks like I'll have to investigate more. I think ffmpeg is multi-threaded so that's something I want to check out. Thanks for the pointers.

Sent from my Galaxy Nexus using Tapatalk 2
 
Status
Not open for further replies.
Top