ZFS Noob
Contributor
- Joined
- Nov 27, 2013
- Messages
- 129
I'm new to ZFS and FreeNAS, but I like what I've learned over the last week, and I got a test build up on a server for testing.
Server Details
The goal up-front is to benchmark how many IOPS this server/software can manage, and I wanted to do that in three parts:
So my test now is IOMETER, 10 workers, running all tests for 5 hours, against a 10 gig data set. The data is hosted on an iSCSI share that my laptop mounted, and my laptop's single GigE connection is plugged into an old 24 port Netgear unmanaged switch I pulled off the shelf to use for the test. I think the switch is good, but I threw out its sister as it was getting iffy after running for a few days.
The Behavior
Async was fast, though apparently I don't know how to read IOMeter results. Overall average IOPS were 6,121, though it also listed 15,367 transactions per second which is weird. I thought IOPS were ~= TPS. Average response time was around 1.5 ms.
Awesome.
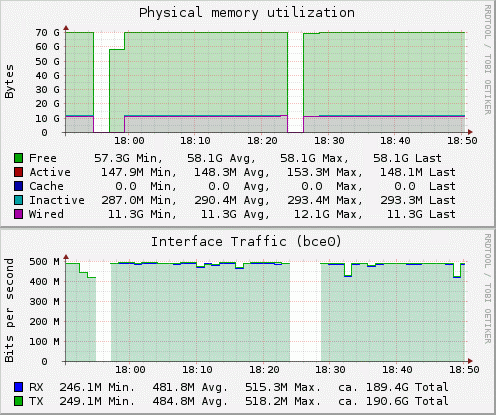
Except I looked at the pretty graphs in FreeNAS and saw this:

Lots and lots of gaps in the performance data. I don't know why they're showing up, and that concerns me. Off the top of my head it could be:
So, what does that look like to y'all? If I rerun the test tomorrow, are there particular diagnostics I can run on the server that will tell me more?
The dataset was 10G, and ARC was 10G, and most everything should have been caching cleanly as every time I checked the server it was only hitting the disks every 5 seconds or so, and for less than a second each time. Maybe one transaction size clogged up the queue while I was away from the computers?
Server Details
- Dual Xeon processors
- 72G RAM
- 4x 2TB ES.3 SAS drives as a striped mirror/RAID10/RAID1+0/whatever the ZFS terminology is for 2 mirrored vdevs sitting in a pool together.
- 4 Gig-E ports, though only one is used for testing.
The goal up-front is to benchmark how many IOPS this server/software can manage, and I wanted to do that in three parts:
- Asynchronously
- Synchronously with no SLOG
- Synchronously again, with the SSD SLOG in place.
So my test now is IOMETER, 10 workers, running all tests for 5 hours, against a 10 gig data set. The data is hosted on an iSCSI share that my laptop mounted, and my laptop's single GigE connection is plugged into an old 24 port Netgear unmanaged switch I pulled off the shelf to use for the test. I think the switch is good, but I threw out its sister as it was getting iffy after running for a few days.
The Behavior
Async was fast, though apparently I don't know how to read IOMeter results. Overall average IOPS were 6,121, though it also listed 15,367 transactions per second which is weird. I thought IOPS were ~= TPS. Average response time was around 1.5 ms.
Awesome.
Except I looked at the pretty graphs in FreeNAS and saw this:

Lots and lots of gaps in the performance data. I don't know why they're showing up, and that concerns me. Off the top of my head it could be:
- ZFS is poorly tuned and I'm running into that issue where queued writes get backlogged and things grind to a halt until things catch up.
- iometer doesn't run that fast that well on a laptop, so it was timing out.
- The network switch is crappy and was showing its own issues.
- Hell, maybe it was the cables I grabbed.
- Maybe the data collection routines on FreeNAS do this under load.
So, what does that look like to y'all? If I rerun the test tomorrow, are there particular diagnostics I can run on the server that will tell me more?
The dataset was 10G, and ARC was 10G, and most everything should have been caching cleanly as every time I checked the server it was only hitting the disks every 5 seconds or so, and for less than a second each time. Maybe one transaction size clogged up the queue while I was away from the computers?
