High HDD and CPU use in idle

Status
Not open for further replies.

BET4

Dabbler
Joined
Jul 1, 2012
Messages
20
Hi everyone. I'm using FreeNAS-8.0.4-RELEASE-p2-x64 (11367).

Some day my wife pulled out flash with freenas so it doesn't work. I reinstalled OS on another flash and run autoimport option for restore access for the data. There's 10TB of stuff.

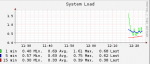
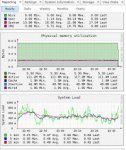
After that for 22 hours my hdd are 100% in use especially ada4 anda ada5. Is it normal?

Code:
    1 users    Load  0.67  0.65  0.30                  Jun 30 12:18
 
Mem:KB    REAL            VIRTUAL                       VN PAGER   SWAP PAGER
        Tot   Share      Tot    Share    Free           in   out     in   out
Act   97888    8916   511996    10880 7308160  count
All  279864   10104 1074339k    18948          pages
Proc:                                                            Interrupts
  r   p   d   s   w   Csw  Trp  Sys  Int  Sof  Flt        cow   11153 total
             33       10k    8  154 7151 1277   11     11 zfod        atkbd0 1
                                                          ozfod  6028 uart0 irq4
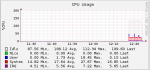
19.0%Sys   4.3%Intr  0.2%User  0.0%Nice 76.6%Idle        %ozfod   292 ata0 irq14
|    |    |    |    |    |    |    |    |    |    |       daefr       ehci0 ehci
==========++                                              prcfr       ohci0 ohci
                                           dtbuf    53155 totfr   830 ahci0 19
Namei     Name-cache   Dir-cache    199978 desvn          react  2001 cpu0: time
   Calls    hits   %    hits   %      3617 numvn          pdwak     1 re0 irq256
     216     216 100                  1006 frevn          pdpgs  2001 cpu1: time
                                                          intrn
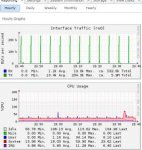
Disks   da0  ada0  ada1  ada2  ada3  ada4  ada5    270576 wire
KB/t   0.00 55.45 54.34 54.65 55.03 87.78 88.00     79048 act
tps       0   228   233   231   229   146   145     27288 inact
MB/s   0.00 12.32 12.34 12.31 12.31 12.49 12.48       784 cache
%busy     0    57    56    54    57   100    99   7307376 free
                                                   116336 buf


Is it normal? How long on this volume of information is the process of autoimport?
 

Attachments

  • 39.png
    39.png
    10.5 KB · Views: 207
  • 40.png
    40.png
    13.7 KB · Views: 232
  • 41.jpg
    41.jpg
    18 KB · Views: 219
  • 42.jpg
    42.jpg
    17.4 KB · Views: 205

BET4

Dabbler
Joined
Jul 1, 2012
Messages
20
Maybe I have to post some other info for clarify situation?

Also it's a problem because of 100% use affect temp of HDD it's between 40 and 43. In normal state it's 35 celsius
 

BET4

Dabbler
Joined
Jul 1, 2012
Messages
20
Situation changes from time to time. E.g. now I get this.

Code:
    1 users    Load  1.40  0.93  0.69                  Jul  1 23:49

Mem:KB    REAL            VIRTUAL                       VN PAGER   SWAP PAGER
        Tot   Share      Tot    Share    Free           in   out     in   out
Act  153144   10724   687224    13292 5504100  count
All 1968336   12708 1074521k    27796          pages
Proc:                                                            Interrupts
  r   p   d   s   w   Csw  Trp  Sys  Int  Sof  Flt        cow    7050 total
             38       23k    4   95 3050 3013             zfod        atkbd0 1
                                                          ozfod   350 uart0 irq4
59.4%Sys   8.7%Intr  0.0%User  0.0%Nice 31.9%Idle        %ozfod   828 ata0 irq14
|    |    |    |    |    |    |    |    |    |    |       daefr       ehci0 ehci
==============================++++                        prcfr       ohci0 ohci
                                           dtbuf   162857 totfr  1871 ahci0 19
Namei     Name-cache   Dir-cache    199978 desvn          react  2000 cpu0: time
   Calls    hits   %    hits   %      3999 numvn          pdwak     1 re0 irq256
                                      1071 frevn          pdpgs  2000 cpu1: time
                                                          intrn
Disks   da0  ada0  ada1  ada2  ada3  ada4  ada5   2013508 wire
KB/t   0.00 76.89 76.98 77.57 76.99 92.26 92.30    124944 act
tps       0   502   501   500   499   414   415     42264 inact
MB/s   0.00 37.69 37.67 37.85 37.54 37.28 37.37      1352 cache
%busy     0    20    21    20    21    60    59   5502848 free
                                                   126256 buf


But 5 mins after I get once again 100% busy
 

cyberjock

Inactive Account
Joined
Mar 25, 2012
Messages
19,526
I'm sorry, but as I'm somewhat of a noob to BSD myself I don't know what commands will lead to what process is using the disk. I assume if you do a "zpool status" a scrub is not in progress?
 

BET4

Dabbler
Joined
Jul 1, 2012
Messages
20
Nope :(

Code:
[root@freenas] ~# zpool status
  pool: NAS
 state: ONLINE
 scrub: none requested
config:

        NAME          STATE     READ WRITE CKSUM
        NAS           ONLINE       0     0     0
          raidz1      ONLINE       0     0     0
            gpt/ada0  ONLINE       0     0     0
            gpt/ada1  ONLINE       0     0     0
            gpt/ada2  ONLINE       0     0     0
            gpt/ada3  ONLINE       0     0     0
            gpt/ada4  ONLINE       0     0     0
            gpt/ada5  ONLINE       0     0     0

errors: No known data errors
 

cyberjock

Inactive Account
Joined
Mar 25, 2012
Messages
19,526
Unfortunately, I'm out of ideas. I have lots of things I'd want to do like get a breakdown of what is reading and writing, but I don't know how to do that in FreeNAS.
 

BET4

Dabbler
Joined
Jul 1, 2012
Messages
20
Meanwhile we I noticed changes some hours ago.

HDD in idle is 0% busy, so it's OK.

But system load and CPU usage still have some activity (but it isn't my activity).

43.png 44.jpg

Here's my top. But there's nothing special:

Code:

last pid:  4123;  load averages:  0.18,  0.12,  0.09                                                                                                                         up 0+05:36:23  21:59:22
40 processes:  1 running, 39 sleeping
CPU:     % user,     % nice,     % system,     % interrupt,     % idle
Mem: 104M Active, 36M Inact, 209M Wired, 1516K Cache, 121M Buf, 7155M Free
Swap: 12G Total, 12G Free

  PID USERNAME    THR PRI NICE   SIZE    RES STATE   C   TIME   WCPU COMMAND
 2438 root          1  48    0 64104K 24460K ttyin   1   9:11  6.05% python
 1933 root          7  44    0 67096K  9676K ucond   0   0:13  0.00% collectd
 1595 root          1  44    0  6776K  1252K select  1   0:05  0.00% powerd
 1836 root          6  44    0   122M 61264K uwait   0   0:05  0.00% python
 1587 root          1  44    0 11784K  2732K select  0   0:01  0.00% ntpd
 2341 www           1  44    0 19332K  4012K kqread  1   0:01  0.00% lighttpd
 2430 root          1  76    0 64104K 24460K ttyin   1   0:01  0.00% python
 1388 root          1  44    0 39216K  6336K select  1   0:00  0.00% nmbd
 2063 root          1  52    0  7836K  1500K nanslp  0   0:00  0.00% cron
 3758 root          1  44    0 33308K  5068K select  0   0:00  0.00% sshd
 1114 root          1  44    0  6908K  1460K select  1   0:00  0.00% syslogd
 1334 root          1  44    0 46792K  9304K select  1   0:00  0.00% smbd
 2256 root          1  44    0  7840K  1528K select  1   0:00  0.00% rpcbind
 3762 root          1  44    0 10176K  2944K pause   0   0:00  0.00% csh
 4090 root          1  44    0 48980K 10044K select  1   0:00  0.00% smbd
 1348 root          1  44    0 46792K  9224K select  0   0:00  0.00% smbd
 2035 root          1  44    0 24980K  4500K select  1   0:00  0.00% sshd
 2260 root          1  76    0  6776K  1552K select  1   0:00  0.00% mountd
 2432 root          1  76    0  6776K  1276K ttyin   1   0:00  0.00% getty
 2431 root          1  76    0  6776K  1276K ttyin   0   0:00  0.00% getty
 2433 root          1  76    0  6776K  1276K ttyin   0   0:00  0.00% getty
 2434 root          1  76    0  6776K  1276K ttyin   0   0:00  0.00% getty
  650 root          1  76    0  5688K  1452K select  1   0:00  0.00% dhclient
 2436 root          1  76    0  6776K  1276K ttyin   0   0:00  0.00% getty
 2437 root          1  76    0  6776K  1276K ttyin   0   0:00  0.00% getty
 2435 root          1  76    0  6776K  1276K ttyin   0   0:00  0.00% getty
 4123 root          1  44    0  9228K  2128K CPU1    1   0:00  0.00% top
  672 _dhcp         1  44    0  5688K  1544K select  1   0:00  0.00% dhclient
  810 root          1  44    0  3204K   716K select  1   0:00  0.00% devd
 

BET4

Dabbler
Joined
Jul 1, 2012
Messages
20
Pffff. Without any reason my NAS is going crazy after 2 weeks of wirking OK. System load and hdd load are 100%. Top is showing just 0.10% use of CPU.
 
Status
Not open for further replies.
Top