Hello there,
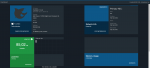
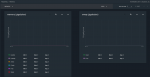
I just started with freenas some weeks ago and encountered a problem: The charts for memory usage, CPU temp etc are not shown on the dashboard page or also on the reports pages after clicking on the button. Memory usage is the for example displayed as zero for all values. Same goes for the other reports.
At first I thought I probably did some misconfiguration while playing aroung wich lead to this problem (I messed aroung with timezones etc).
I did a clean reinstall of the software today and it seemed to work just fine, until I imported my old pool with the jails I created earlier.
So this seems to be connected but I have no idea how and why so it would be great if someone had an idea what the problem could be.
My Freenas version is:
FreeNAS-11.2-U6
(Build Date: Sep 17, 2019 0:16)
System Information
AMD Ryzen 7 2700X Eight-Core Processor
1 x 16GB Samsung M391A2K43BB1-CTD DDR4-2666 ECC
ASUS TUF B450M-Plus
Boot drives
Samsung MUF-32AB/EU USB 3.1 Flash Drive FIT Plus 32GB
Pool with jails on
128GB ADATA XPG SX6000 Lite M.2 2280 PCIe 3.0 x4 NVMe
Chrome developer tools on dashboard page tell
I attached a picture of the dashboard page and the memory reports
I am happy to provide further information if needed or helpful
I just started with freenas some weeks ago and encountered a problem: The charts for memory usage, CPU temp etc are not shown on the dashboard page or also on the reports pages after clicking on the button. Memory usage is the for example displayed as zero for all values. Same goes for the other reports.
At first I thought I probably did some misconfiguration while playing aroung wich lead to this problem (I messed aroung with timezones etc).
I did a clean reinstall of the software today and it seemed to work just fine, until I imported my old pool with the jails I created earlier.
So this seems to be connected but I have no idea how and why so it would be great if someone had an idea what the problem could be.
My Freenas version is:
FreeNAS-11.2-U6
(Build Date: Sep 17, 2019 0:16)
System Information
AMD Ryzen 7 2700X Eight-Core Processor
1 x 16GB Samsung M391A2K43BB1-CTD DDR4-2666 ECC
ASUS TUF B450M-Plus
Boot drives
Samsung MUF-32AB/EU USB 3.1 Flash Drive FIT Plus 32GB
Pool with jails on
128GB ADATA XPG SX6000 Lite M.2 2280 PCIe 3.0 x4 NVMe
Chrome developer tools on dashboard page tell
ERROR TypeError: Cannot read property 'length' of undefinedI attached a picture of the dashboard page and the memory reports
I am happy to provide further information if needed or helpful