Top Menu

Across the top row are links to outside resources and buttons to control the system. The options described from left to right: Logos and Side Panel Controls Status Icons Task Manager Alerts Settings Power Click the links above to jump to the sections with details on these top toolbar options. Logos and Side Panel Controls The logo in the upper-left corner shows the installed TrueNAS software. Clicking the image takes you to the system Dashboard.
Read full post gdoc_arrow_right_alt

Alert Settings Screens

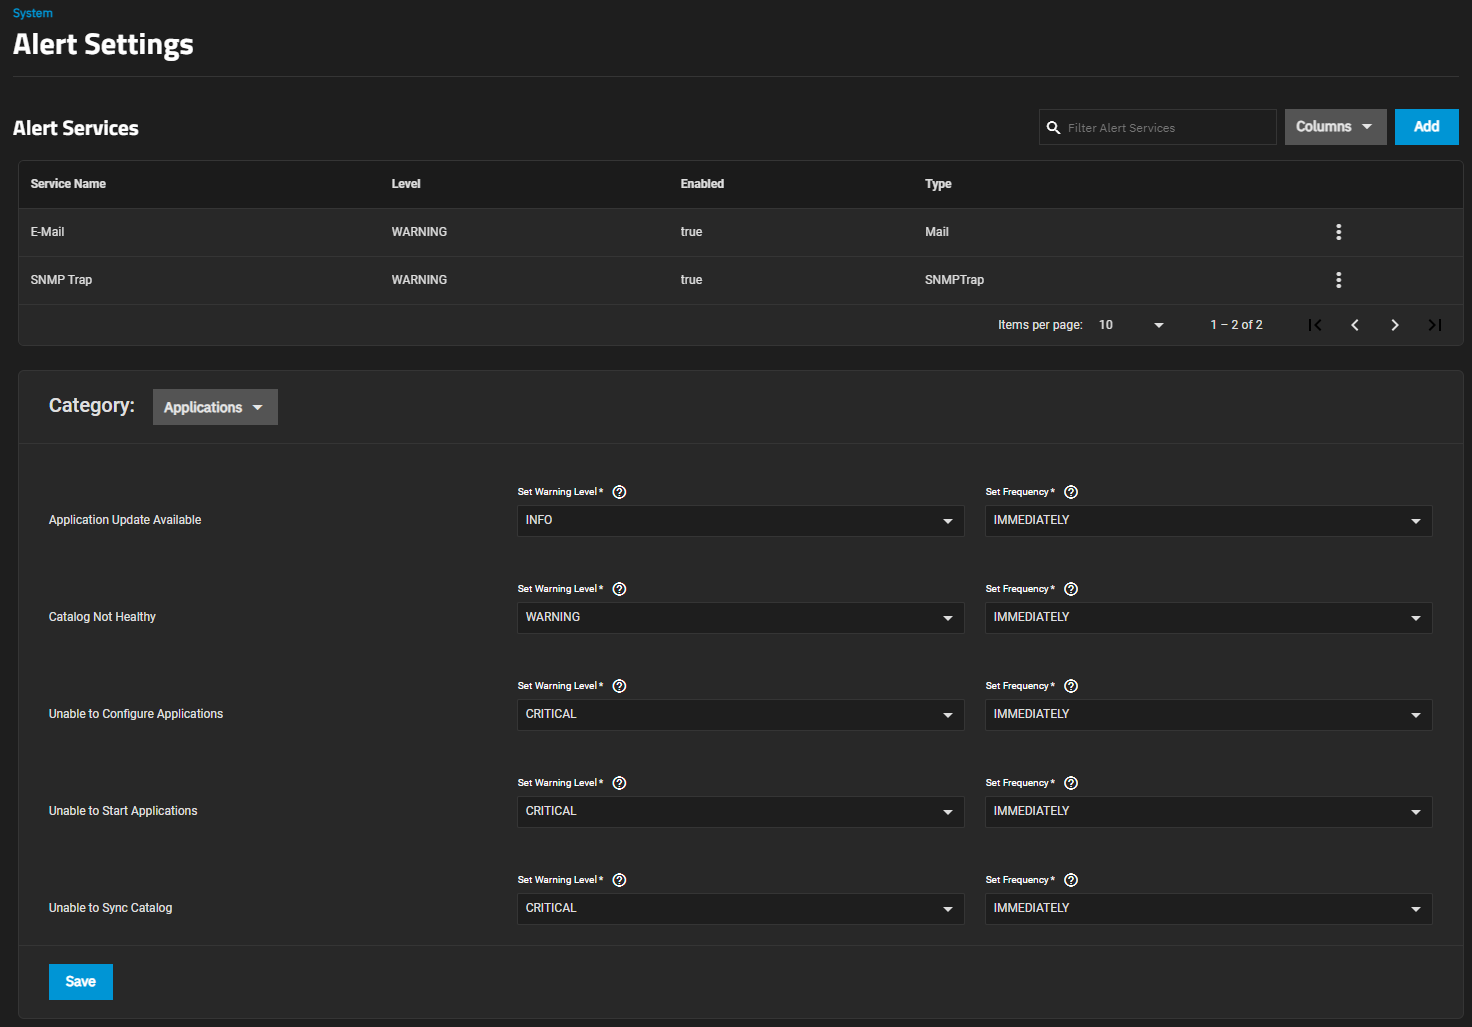
The Alert Settings screen displays options to create and edit alert services and to configure warning levels and frequencies. To access this screen, click the notifications icon, then click the settings icon and select Alert Settings on the dropdown list. Use Columns to change the information displayed in the list of alert services. Options are Unselect All, Type, Level, Enabled and Reset to Defaults. Add/Edit Alert Service Screen The Add Alert Service and Edit Alert Service screens show the same settings.
Read full post gdoc_arrow_right_alt

Dashboard

The TrueCommand Dashboard provides an overview of each connected TrueNAS system in system widgets (information cards). The top banner includes two sort options, one to filter the view to show All or Ungrouped systems and the other to sort either by Name or Order. The default view shows all widgets for all NAS systems added to and managed by TrueCommand. Use the Find field to search for a system by name.
Read full post gdoc_arrow_right_alt

Managing Alerts

TrueCommand alerts provide visual warnings for monitored systems that require attention. Monitored TrueNAS systems and TrueCommand alert rules can both generate alerts. TrueCommand can discover and show TrueNAS system alerts created created in the last two months. Alerts older than this do not show in TrueCommand. Administrator accounts can see all system alerts but non-administrator accounts can only see alerts on systems they are permitted to access. TrueCommand provides three alert screen options:
Read full post gdoc_arrow_right_alt

Alert

Alert Namespace The alert namespace has seven commands and is based on alert functions found in the SCALE API and web UI. It provides access to alert management methods through the alert commands. Alert Commands The following alert commands allow you to view and manage alerts and policies. You can enter commands from the main CLI prompt or from the alert namespace prompt. The SCALE CLI guide is a work in progress!
Read full post gdoc_arrow_right_alt

Fleet Dashboard

In addition to the main TrueCommand Dashboard that shows individual system widgets (information cards) with performance information for each system managed by TrueCommand, release 3.0 introduces a new Fleet Dashboard with new function widgets. The Fleet Dashboard provides an overview of system information organized into six widgets: Systems - Lists each system managed by TrueCommand. Alerts - Lists alerts detected on systems managed by TrueCommand. Pools - Lists all pools detected on systems managed by TrueCommand.
Read full post gdoc_arrow_right_alt

Alert Notifications

The Alert Notifications panel displays system alerts. It provides options to dismiss or reopen dismissed alerts on your TrueNAS. Alerts Panel Options Name Description Dismiss Dismisses a single alert. Re-Open Re-opens a recently dismissed alert. Dismiss All Alerts Dismisses all alerts. Re-Open All Alerts Displays at the bottom of the panel if you dismiss more than one alert. Click to re-open all dismissed alerts if they are still active. Alert Levels Level Icon Notification Warning Critical One-shot Critical

Changing Alert Colors

TrueCommand includes the ability to customize the alert colors to user preferences. The Theme settings pallet is located in the top banner on the right. Changing Theme Settings To open the theme configuration menu, click the palette icon. To change a color, click on the color to open a selection menu, then choose a color or enter its HEX color value. To remove changes and revert to the currently saved settings, click RESET.
Read full post gdoc_arrow_right_alt

Email Screens

The top toolbar Alerts notifications icon button and settings icon display the Alerts dropdown list with two options: Alert Settings and Email. Select Email to go to the General settings screen and find the Email widget. Email Widget The Email widget on the General settings screen displays information about current system mail settings. Figure 1: Email Widget Settings opens the Email Options screen that allows users to configure the system email send method.
Read full post gdoc_arrow_right_alt

Interface Overview

Top Toolbar Figure 1: Top Bar The top toolbar switches between the various TrueCommand feature screens and has other quick links and dropdown menus for other configuration screens. Option Description Home Opens the primary TrueCommand Dashboard with live stats and options for connected TrueNAS systems. Fleet Dash The expanded Fleet Dashboard collects metrics, notifications, and configuration details for every connected TrueNAS system. Clusters The (deprecated) Clusters page manages configurations of synchronized TrueNAS systems that are functioning as a single data storage cluster.
Read full post gdoc_arrow_right_alt