Storage
12 minute read.
The Storage Dashboard screen allows users to configure and manage storage resources such as pools (VDEVs) and disks. The dashboard widgets organize functions related to storage resources.
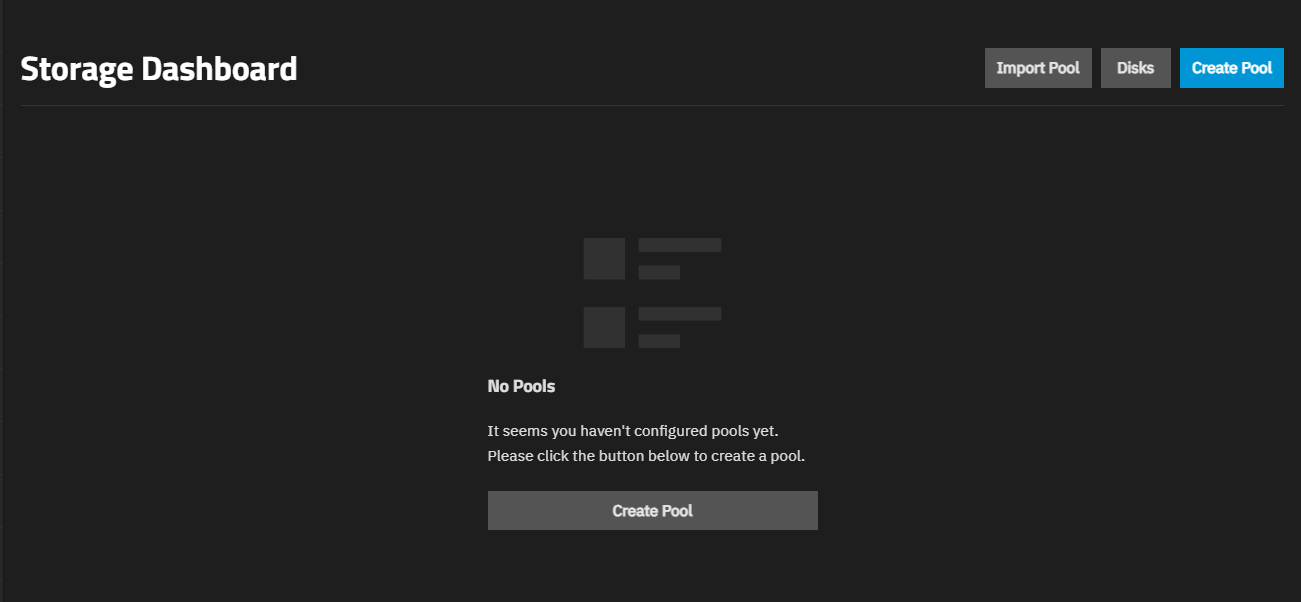
The No Pools screen displays before you add the first pool.
The Create Pool button in the center of the screen opens the Pool Creation Wizard screen.
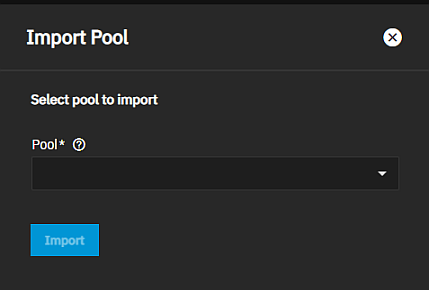
The buttons at the top right of the Storage Dashboard screen provide access to pool and disk functions:
Disks opens the Disks screen.
Create Pool opens the Pool Creation Wizard.
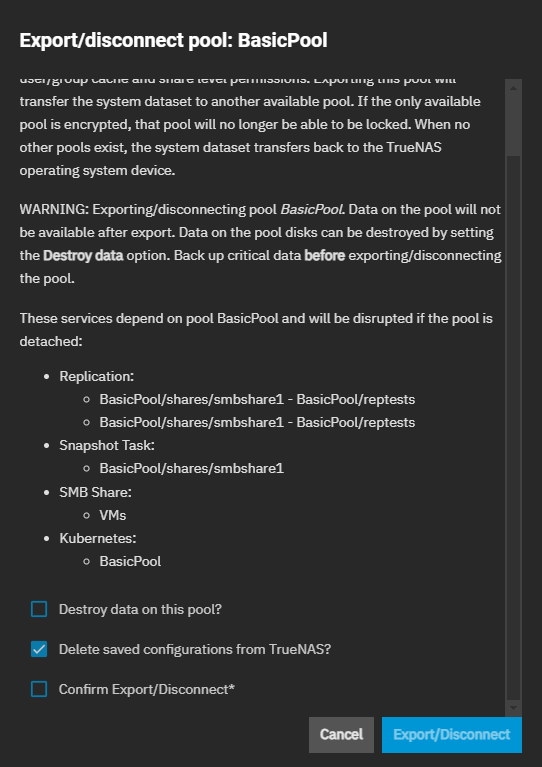
After adding pools, the dashboard shows the pool widgets and additional buttons.
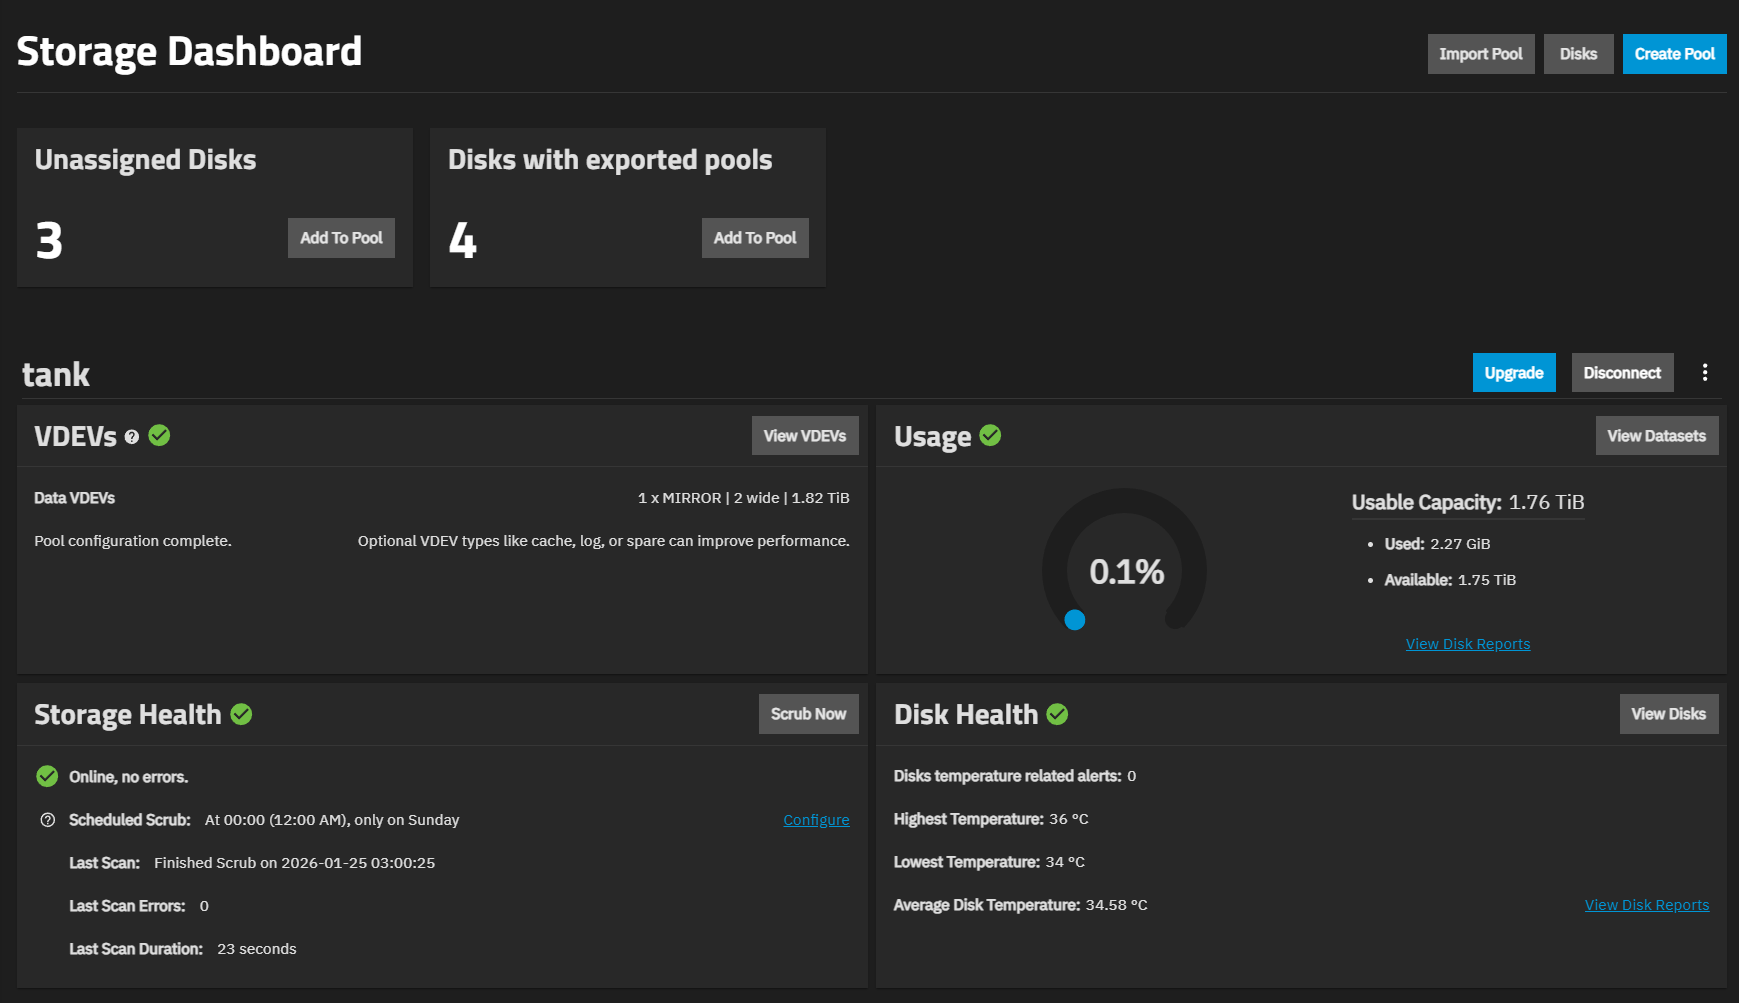
After adding a pool, the screen displays storage and pool widgets.
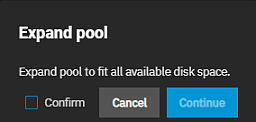
The set of four pool widgets and the Export/Disconnect and Expand buttons show for each pool created on the system.
Each set of pool widgets provides access to screens for disks, datasets, VDEVs, snapshots, quotas, and pool ZFS functions for the pool. For example, Manage Devices on the Topology widget opens the Devices screen with the VDEVs configured for only that pool.
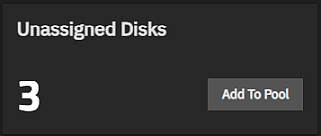
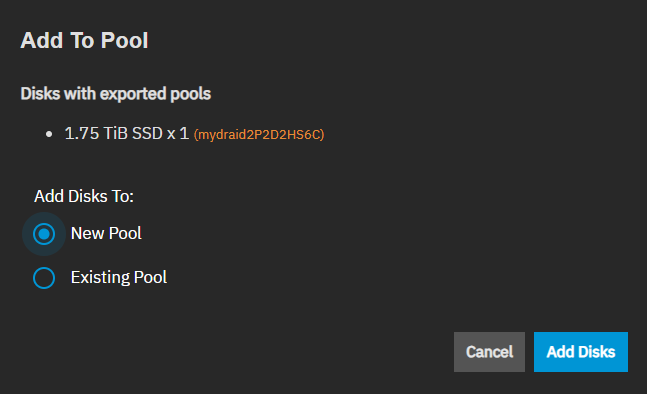
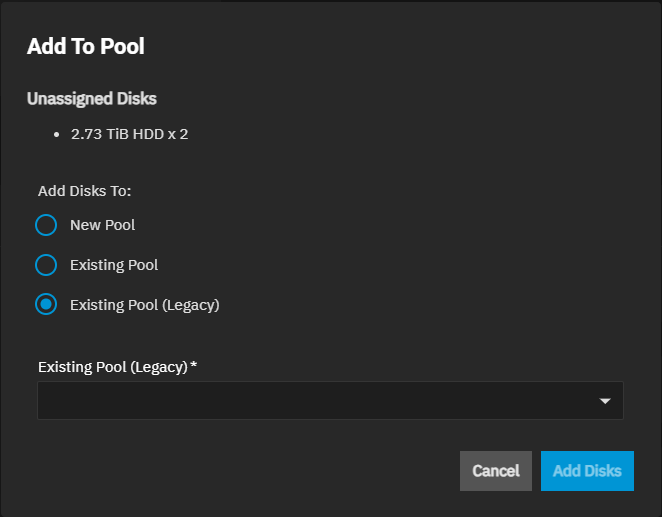
The Unassigned Disks widget at the top of the Storage Dashboard shows when disks are available to add to a new or existing pool. If the system has disks available and that are associated with exported pools, the Disks with Exported pools shows instead. The number of available disks shows, and the Add to Pool button. The pool with the system dataset, and the state of the pool, shows in the dialog.
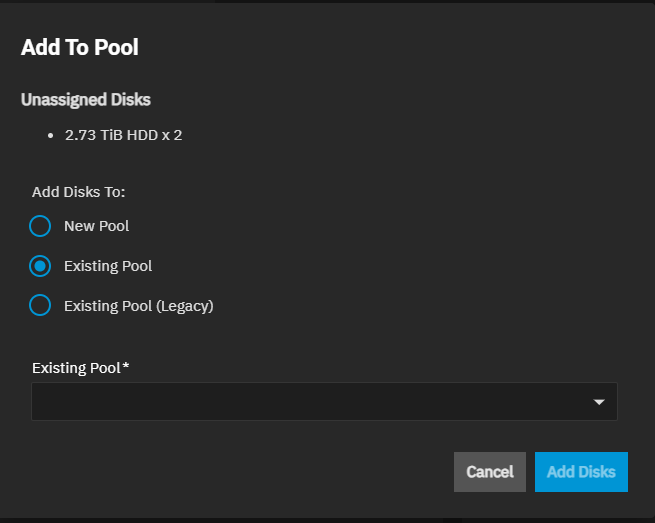
Add to Pool opens a window with two options:
- New Pool
- Existing Pool
Existing Pool shows the Existing Pool dropdown list of pools on the system.
Add Disks opens the Pool Creation Wizard when New Pool is selected. It opens the Add VDEVs to Pool wizard when Existing Pool is selected. The Storage link in the breadcrumb at the top of the screen returns you to the Storage Dashboard to cancel out of adding to a new or existing pool.
If you attempt to use a disk assigned in an exported pool, a warning message prompts you to select a different disk.
To see information on each disk on the system, click View Disks on the Disk health widget
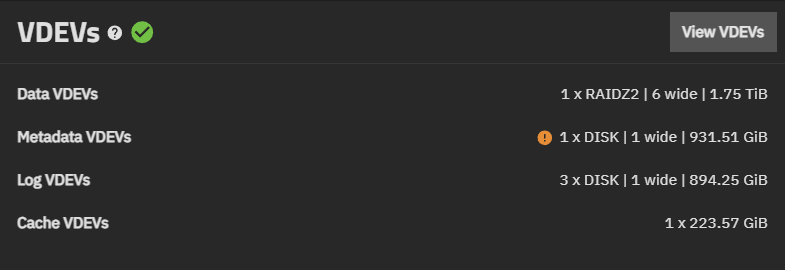
The VDEVs widget shows information on the VDEVs configured on the system and the status of the pool.
The widget lists each VDEV type (data, metadata, log, cache, spare, and dedup) associated with the pool. A Data VDEV includes the data type (stripe, mirror, RAID, or mixed configuration), the number of disks (wide), and the storage capacity of that VDEV.
View VDEVs opens the VDEVs screen where you can add or manage existing VDEVs.
Each pool widget includes a color-coded icon just to the right of the header, near the VDEV lists to indicate the state of the pool VDEV, or near disks in the VDEV. Possible states are:
- Green circle with checkmark for a Healthy
- Orange circle with an exclamation mark for No Redundancy or Pool is Unhealthy
- Red circle with an x for Pool is not Healthy
This same information displays on the main Dashboard on the Storage widget and a pool widget.
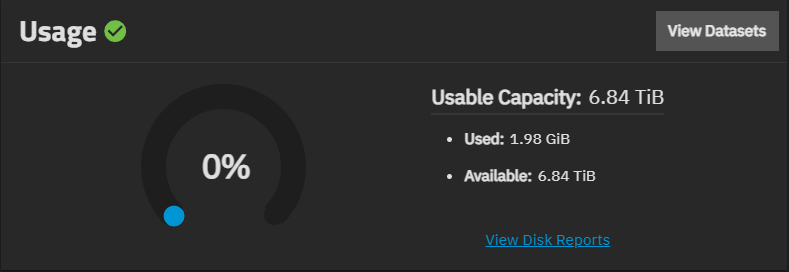
The Usage widget shows information on the pool space datasets consumed and the status of pool usage.
The widget includes a color-coded donut chart that illustrates the percentage of space the pool uses. Blue indicates space usage in the 0-80% range, and red indicates anything above 80%. A warning message displays below the donut graph when usage exceeds 80%.
Usable Capacity details pool space statistics by Used and Available.
View Disk Reports opens the pool usage reports for the selected pool.
Large (>1 petabyte) systems could report storage numbers inaccurately. Storage configurations with more than 9,007,199,254,740,992 bytes round to the last 4 digits. For example, a system with 18,446,744,073,709,551,615 bytes reports the number as 18,446,744,073,709,552,000 bytes.
View Datasets opens the Datasets screen.
The Storage Health widget shows health-of-the-pool information.
Possible widget details include:
- Pool status shows the pool status as** Online, no errors** or Offline, Degraded no errors.
- Scheduled Scrub shows the time based on a 24-hour clock and frequency of a scheduled scrub (the day the task runs).
- Auto TRIM shows the auto trim feature as on or off.
- Last Scan shows the date and time of the last completed scrub.
- Last Scan Errors shows the number of errors detected during the last scrub.
- Last Scan Duration shows the time, in minutes and seconds, that the last scrub ran.
- Deduplication Table only shows if a dedup VDEV is added to the pool. Shows the size of the deduplication table.
Scrub Now opens the Scrub Pool dialog. Start Scrub in the Scrub Pool dialog runs a check on the data integrity of the pool. Scrubs identify data integrity problems, detect silent data corruptions caused by transient hardware issues, and provide early disk failure alerts.
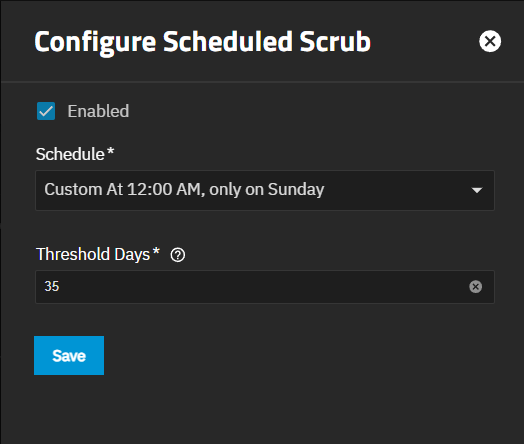
Configure opens the Configure Scheduled Scrub screen.
Prune and Set Quota only show if the pool has a dedup VDEV and it contains duplicated files in the pool.
The Configure Scheduled Scrub screen sets a schedule for TrueNAS to run a scrub operation.
A scrub is a data integrity check of your pool. Scrubs identify data integrity problems, detect silent data corruptions caused by transient hardware issues, and provide early disk failure alerts. By default, TrueNAS automatically checks every pool to verify it is on a recurring scrub schedule. If TrueNAS detects problems during the scrub, it corrects them automatically or generates an alert.
Enabled shows the schedule information on the Storage Health dashboard as the value for Scheduled Scrub. When disabled, Scheduled Scrub changes to Not Set and shows the Schedule link. Schedule opens the Configure Scheduled Scrub screen.
Schedule shows a dropdown list of schedule options:
- Hourly, which runs the scrub at the start of each hour.
- Daily, which runs a scrub at 00:00 on the 24-hour clock. This is the time period where system processes and demands are likely at the lowest point, and where it reduces the drain on system resources.
- Weekly, which runs the scrub on Sundays at 00:00 for the same reason as with the Daily option.
- Monthly, which runs on the first day of the month at 00:00.
- Custom, which runs at 12.00 AM, only on Sunday. ** Create, which opens the custom schedule window where you can select the frequency (how often it runs), time (in hours and minutes), start or finish times, and set a time zone.
Threshold Days sets the days before a completed scrub is allowed to run again. This controls the task schedule. For example, scheduling a scrub to run daily and setting threshold days to 7 means the scrub attempts to run daily. When the scrub is successful, it continues to check daily but does not run again until seven days have elapsed. Using a multiple of seven ensures the scrub always occurs on the same weekday.
Save sets the schedule and adds the time and frequency to the Storage Health widget.
Starting in TrueNAS 25.10, resilver priority settings are now located in System Settings > Advanced Settings on the Storage widget.
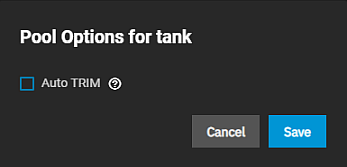
The Edit Auto TRIM option on the ZFS Health widget opens a dialog to set Auto TRIM.
When enabled, Auto TRIM allows TrueNAS to periodically review data blocks and identify which empty blocks of obsolete blocks it can delete. Leave unselected to incorporate day block overwrites when a device write is started (default). Select Confirm to activate Save.
For more details about TRIM in ZFS, see the autotrim property description in zpool.8.
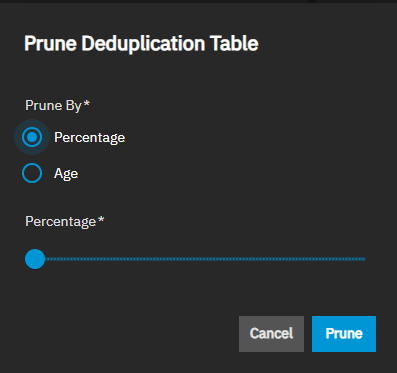
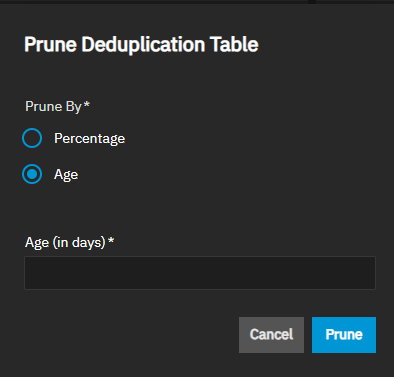
The Prune Deduplication Table dialog shows pruning measurement options the system should use when pruning the deduplication table (DDT). Options are Percentage and Age.
Percentage shows a slider to set the size (maximum amount of storage) percentage threshold the DDT is filled before it reaches the maximum size. When reached, the system prunes the table.
Age shows the Age (in days) field where you enter the number of days between pruning processes the system waits before automatically pruning the DDT.
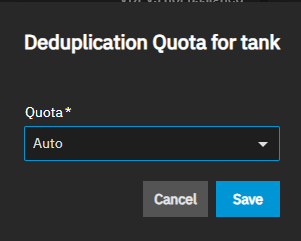
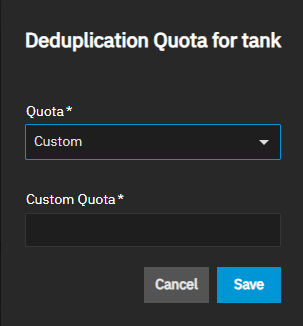
The Deduplication Quota for poolname shows the Quota dropdown list with three options for setting the maximum size limit the deduplication table can reach.
Auto is the default option, which allows the system to set the quota and the size of a dedicated dedup VDEV. This property works for both legacy and fast dedup tables.
Custom shows the Custom Qutoa field where you enter the maximum size of the DDT (quota).
None disables the quota.
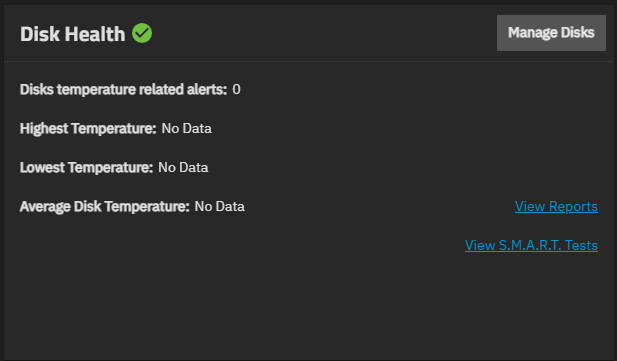
The Disk Health widget shows information on the health of the disks in a pool.
The disk health details include:
- Disk temperature-related alerts
- Highest Temperature
- Lowest Temperature
- Average Disk Temperature
TrueNAS complies with SAS/SATA specifications and reports temperatures in Celsius. TrueNAS converts Kelvin to Celsius
View Disks opens the Storage > Disk screen.
View Reports opens the Report screen for the disks in the selected pool.
The Storage Dashboard shows the Upgrade button for existing pools after an upgrade to a new TrueNAS release that includes new OpenZFS feature flags. Newly created pools are always up-to-date with the OpenZFS feature flags in the installed TrueNAS release.
Storage pool upgrades are typically not required unless the new OpenZFS feature flags are deemed necessary for required or improved system operation. Consider these factors before upgrading a storage pool to the latest OpenZFS feature flags.
Upgrading can affect data. Before performing any operation that affects data on a storage disk, always back up data first and verify the backup integrity.
New OpenZFS feature flags are permanently applied to the upgraded pool. An upgraded pool cannot be reverted or downgraded to an earlier OpenZFS version. A storage pool with the latest feature flags cannot import into another operating system that does not support those feature flags.
Upgrading a ZFS pool is optional. Do not upgrade the pool when reverting to an earlier TrueNAS version or repurposing the disks in another operating system that supports ZFS is a requirement.
The upgrade only takes a few seconds and is non-disruptive. However, it is best to upgrade when the pool is not in heavy use.
The upgrade process suspends I/O for a short period but is nearly instantaneous on a quiet pool.
It is not necessary to stop any sharing services to upgrade the pool.


