Reporting
4 minute read.
TrueNAS has a built-in reporting engine that provides helpful graphs and information about the system.
TrueNAS uses Netdata to gather metrics, create visualizations, and provide reporting statistics.
The built-in Netdata UI, accessible from the Netdata button on the Reporting screen in TrueNAS 24.04 and 24.10, is removed in TrueNAS 25.04 (and later) for security hardening. Users wishing to continue using the Netdata UI to monitor system reports can install the Netdata application.
Reporting data is saved to permit viewing and monitoring usage trends over time. This data is preserved across system upgrades and restarts.
TrueCommand offers enhanced features for reporting like creating custom graphs and comparing utilization across multiple systems.
Click on and drag a certain range of the graph to expand the information displayed in that selected area in the Graph. Click on the icon to zoom in on the graph. Click on the icon to zoom out on the graph. Click the to move the graph forward. Click the to move the graph backward.
You can configure TrueNAS to export Netdata information to any time-series database, reporting cloud service or application installed on a server. For example, Graphite, Grafana, etc., installed on a server or use their cloud service.
Creating reporting exporters enables TrueNAS to send Netdata data reporting metrics, formatted as a JSON object, to another reporting entity.
For more information on exporting Netdata records to other servers or services, refer to the Netdata exporting reference guide.
Graphite is a monitoring tool available as an application you can deploy on a server or use their cloud service. It stores and renders time-series data based on a plaintext database. Netdata exports data reporting metrics to Graphite in the format prefix.hostname.chart.dimension. For additional information, see the Netdata Graphite exporting guide.
To configure a reporting exporter in TrueNAS, you need the:
- IP address of the reporting service or server. If using another TrueNAS system with a data reporting application, this is the IP address of the TrueNAS running the application.
- Port number the reporting service listens on. If using another TrueNAS system with a reporting application, this is the port number the TrueNAS system listens on (port:80)
For more information on reporting exporter settings, see Add Reporting Exporter.
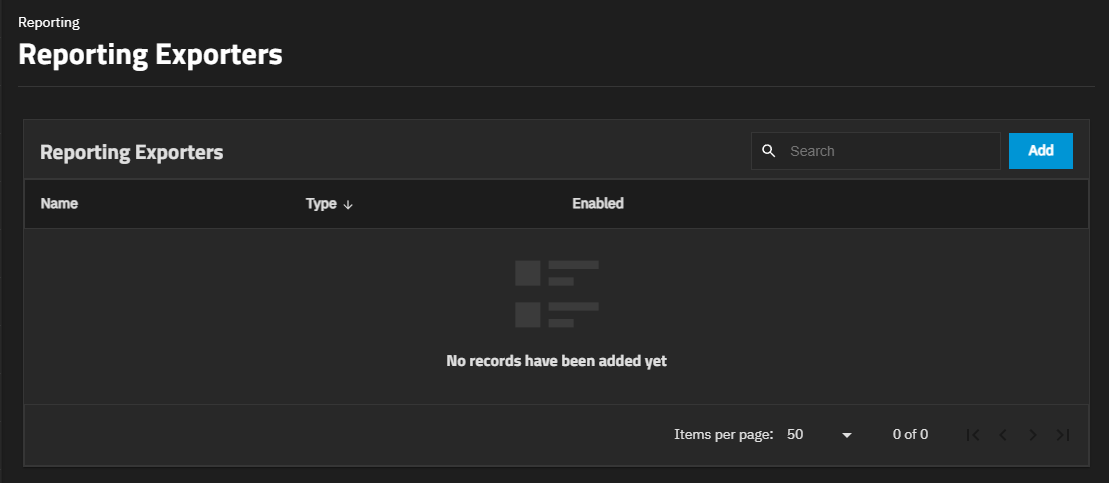
Go to Reporting and click on Exporters to open the Reporting Exporters screen. Any reporting exporters configured on the system display on the Reporting Exporters screen.
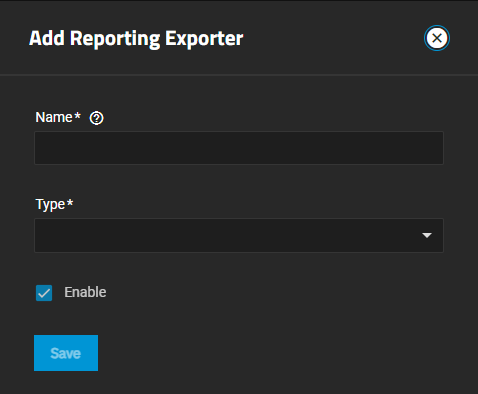
Click Add to open the Add Reporting Exporter screen to configure a third party data reporting integration.
Enter a unique name for the exporter configuration in Name. When configuring multiple exporter instances, give each a distinct name.
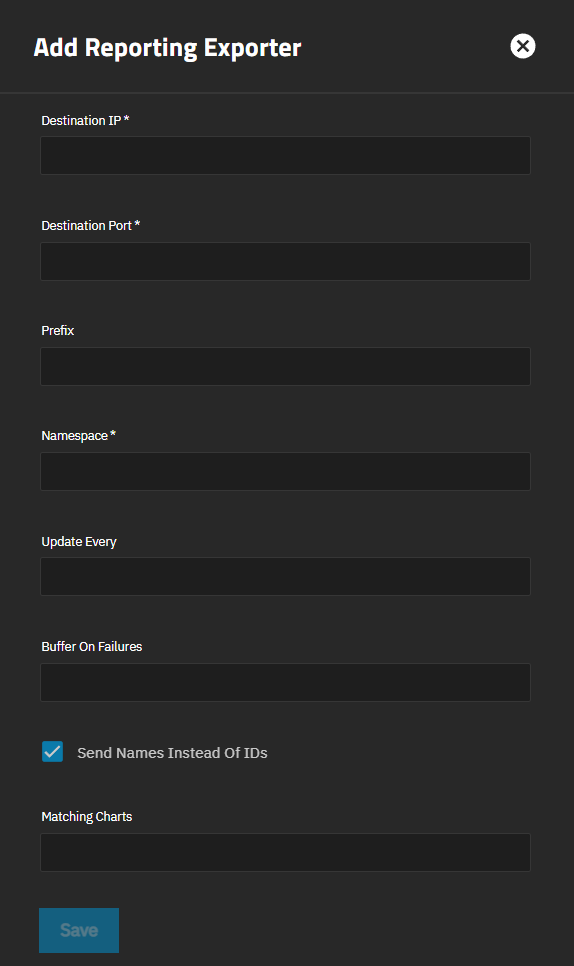
Select the report object format from Type. At present, only GRAPHITE is available. The screen shows the exporter configuration fields.
Select Enable to send reporting metrics to the configured exporter instance. Clearing the checkmark disables the exporter without removing configuration.
Enter the IP address for the data collection server or cloud service.
Enter the port number the report collecting server, etc. listens on.
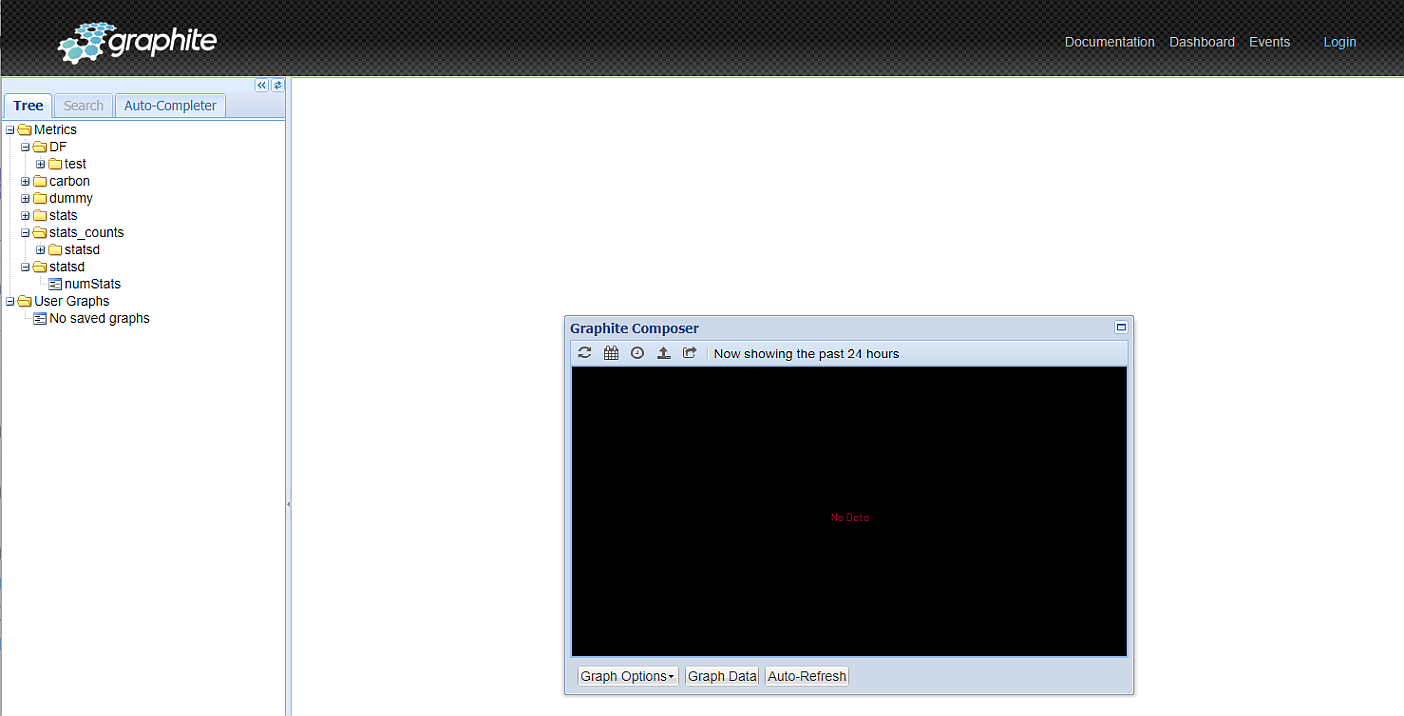
Enter the file hierarchy structure, or where in the collecting server, etc. to send the data. First enter the top-level in Prefix and then the data collection folder in the Namespace field. For example, entering DF in Prefix and test in Namespace creates two folders in Graphite with DF as the parent to Test.
You can accept the defaults for all other settings, or enter configuration settings to match your use case.
Click Save.
To view the Graphite web UI, enter the IPaddress:Port# of the system hosting the application.
TrueNAS can now export the data records as Graphite-formatted JSON objects to the other report collection and processing application, service, or servers.
TrueNAS also populates the exporter screen with default settings. To view these settings, click Edit on the row for the exporter.


