TrueNAS SCALE Nightly Development Documentation
This content follows experimental early release software. Use the Product and Version selectors above to view content specific to a stable software release.
Prometheus
6 minute read.
Last Modified 2024-06-11 10:49 EDTPrometheus is a monitoring platform that collects metrics from targets it monitors. Targets are system HTTP endpoints configured in the Prometheus web UI. Prometheus is itself an HTTP endpoint so it can monitor itself.
Prometheus collects and stores metrics such as time series data. Information stored is time-stamped at the point when it is recorded. Prometheus uses key-value pairs called labels to differentiate characteristics of what is measured.
Use the Prometheus application to record numeric time series. Also use it to diagnose problems with the monitored endpoints when there is a system outage.
TrueNAS SCALE makes installing Prometheus easy, but you must use the Prometheus web portal to configure targets, labels, alerts, and queries.
Application maintenance is independent from TrueNAS SCALE version release cycles. App versions, features, fields, and install behavior at the time of access might vary from those in documented tutorials, especially for legacy version documentation that no longer receives active updates.
We welcome community contributions to keep this documentation current! Click Edit Page in the top right corner to propose changes to this article. See Updating Content for more information.
The Prometheus app in SCALE installs, completes the initial configuration, then starts the Prometheus Rule Manager. When updates become available, SCALE alerts and provides easy updates.
Before installing the Prometheus app in SCALE, review their Configuration documentation and list of feature flags and environment variables to see if you want to include any during installation. You can configure environment variables at any time after deploying the application.
SCALE does not need advance preparation.
If not using the default user and group to manage the application, create a new user (and group) and take note of the IDs.
You can allow SCALE to create the two datasets Prometheus requires automatically during app installation. Or before beginning app installation, create the datasets named data and config to use in the Storage Configuration section during installation.
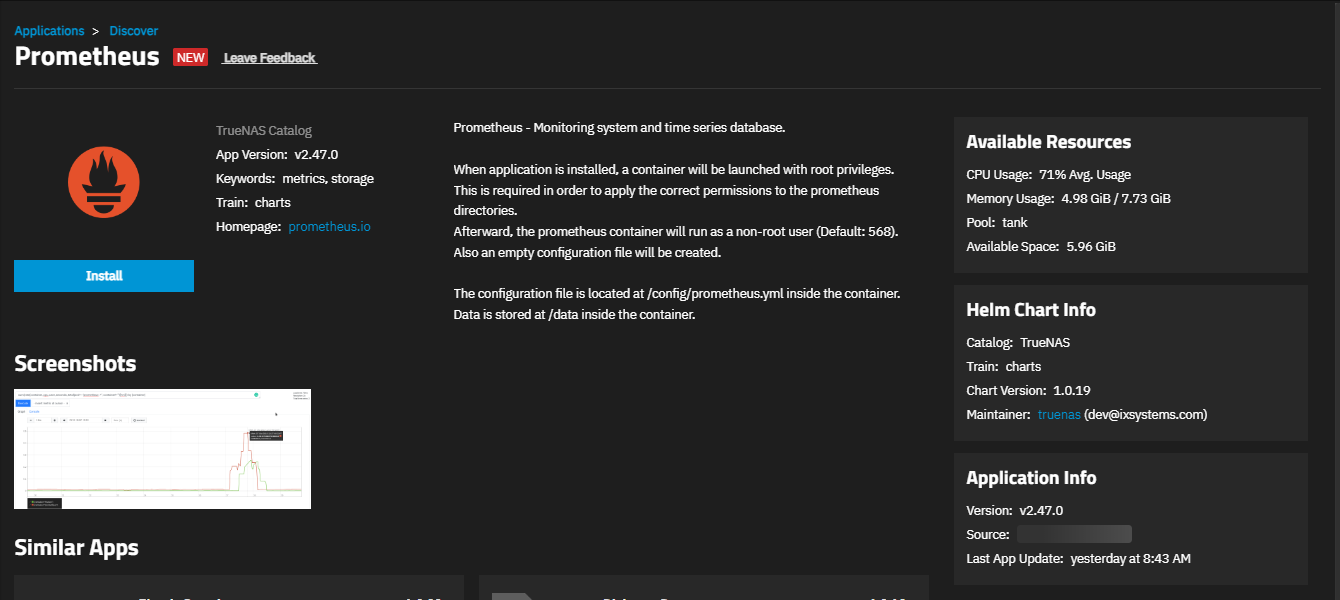
To install the Prometheus application, go to Apps, click Discover Apps, either begin typing Prometheus into the search field or scroll down to locate the Prometheus application widget.
Click on the widget to open the Prometheus application details screen.
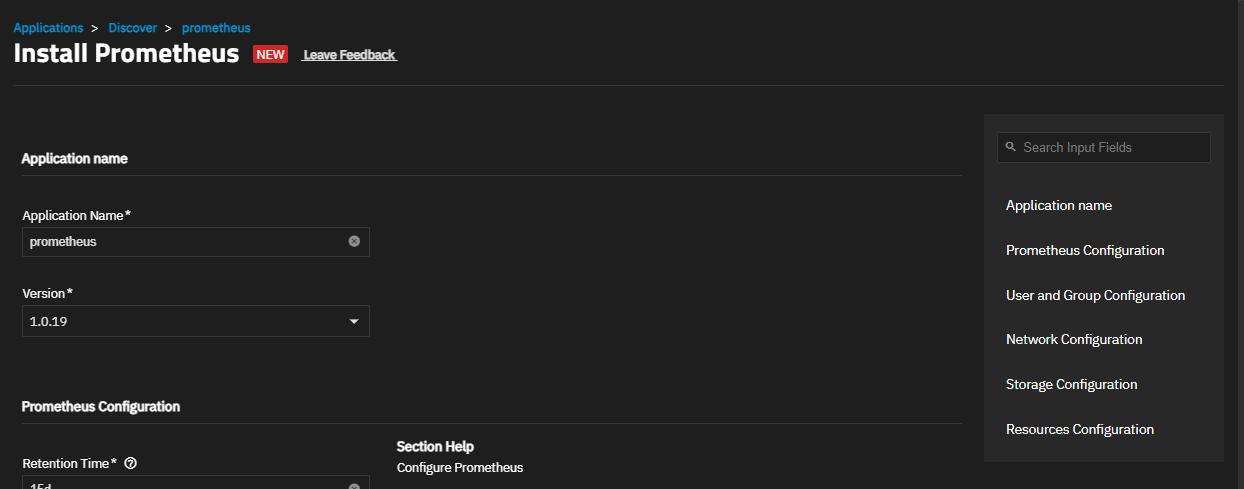
Click Install to open the Prometheus application configuration screen.
Application configuration settings are presented in several sections, each explained below. To find specific fields click in the Search Input Fields search field, scroll down to a particular section or click on the section heading on the navigation area in the upper-right corner.
Accept the default values in Application Name and Version.
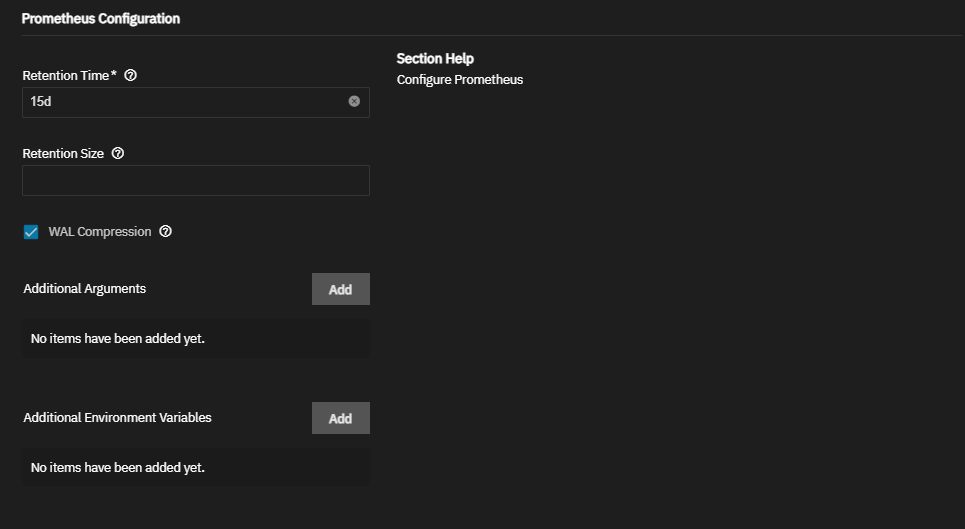
Accept the default value in Retention Time or change to suit your needs. Enter values in days (d), weeks (w), months (m), or years (y). For example, 15d, 2w, 3m, 1y.
Enter the amount of storage space to allocate for the application in Retention Size. Valid entries include integer and suffix, for example: 100MB, 10GB, etc.
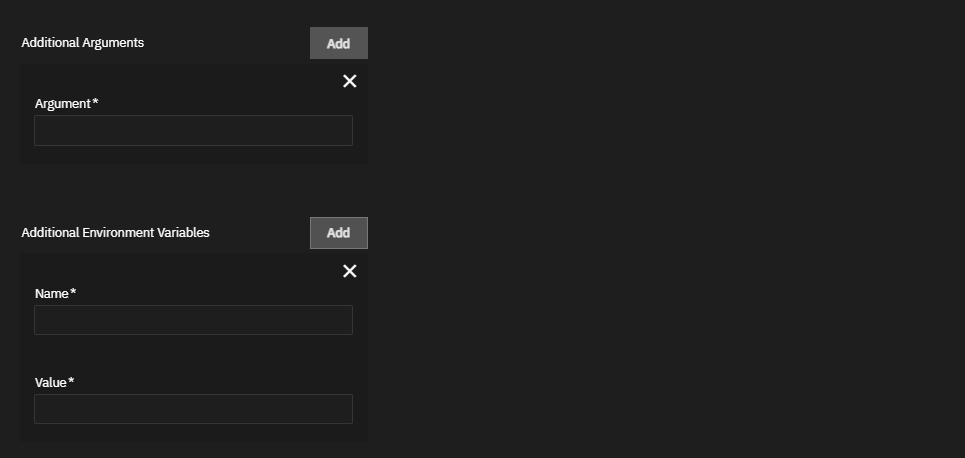
You can add arguments or environment variables to customize your installation but these are not required. To show the Argument entry field or the environment variable Name and Value fields, click Add for whichever type you want to add. Click again to add another argument or environment variable.
Accept the default port in API Port. Select Host Network to bind to the host network, but we recommend leaving this disabled.
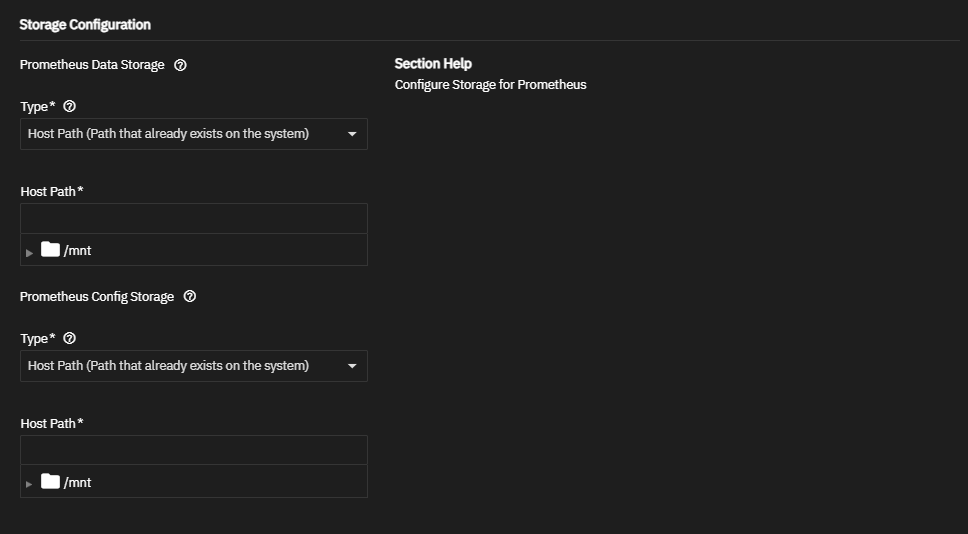
Prometheus requires two storage datasets. You can allow SCALE to create these for you, or use the datasets named data and config created before in First Steps. Select the storage option you want to use for both Prometheus Data Storage and Prometheus Config Storage. Select ixVolume in Type to let SCALE create the dataset or select Host Path to use the existing datasets created on the system.
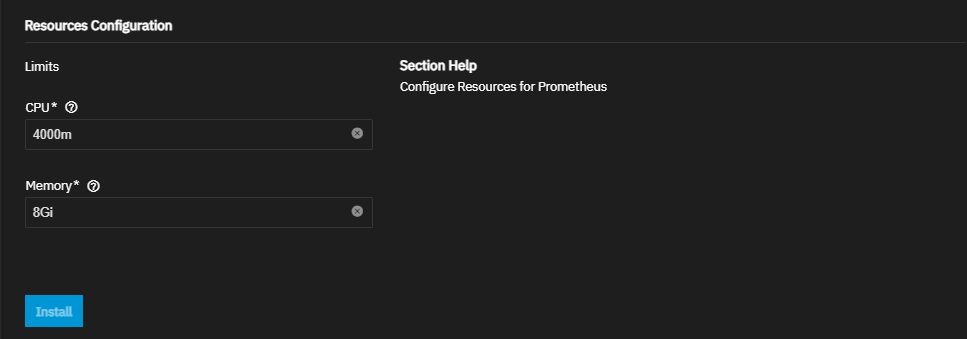
Accept the defaults in Resources or change the CPU and memory limits to suit your use case.
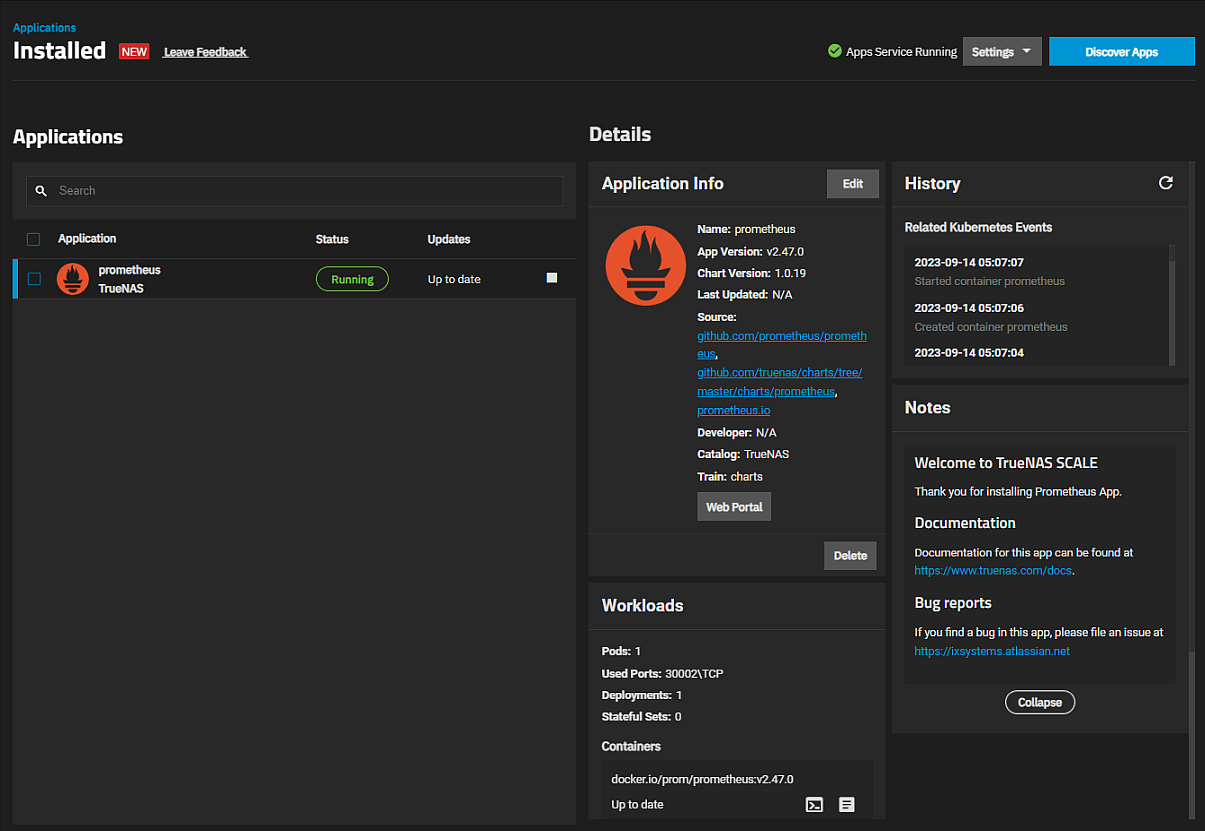
Click Install. The system opens the Installed Applications screen with the Prometheus app in the Deploying state. When the installation completes it changes to Running.
Click Web Portal on the Application Info widget to open the Prometheus web interface to begin configuring targets, alerts, rules and other parameters.
The following sections provide more detailed explanations of the settings found in each section of the Install Prometheus screen.
Accept the default value or enter a name in Application Name field. In most cases use the default name, but if adding a second deployment of the application you must change this name.
Accept the default version number in Version. When a new version becomes available, the application has an update badge. The Installed Applications screen shows the option to update applications.
You can accept the defaults in the Prometheus Configuration settings, or enter the settings you want to use.
Accept the default in Retention Time or change to any value that suits your needs. Enter values in days (d), weeks (w), months (m), or years (y). For example, 15d, 2w, 3m, 1y.
Retention Size is not required to install the application. To limit the space allocated to retain data, add a value such as 100MB, 10GB, etc.
Select WAL Compression to enable compressing the write-ahead log.
Add Prometheus environment variables in SCALE using the Additional Environment Variables option. Click Add for each variable you want to add. Enter the Prometheus flag in Name and desired value in Value. For a complete list see Prometheus documentation on Feature Flags.
Accept the default port numbers in API Port. The SCALE Prometheus app listens on port 30002.
Refer to the TrueNAS default port list for a list of assigned port numbers. To change the port numbers, enter a number within the range 9000-65535.
We recommend not selecting Host Network. This binds to the host network.
You can install Prometheus using the default setting ixVolume (dataset created automatically by the system) or use the host path option with the two datasets created before installing the app.
Select Host Path (Path that already exists on the system) to browse to and select the data and config datasets. Set Prometheus Data Storage to the data dataset path, and Prometheus Config Storage to the config dataset path.
Accept the default values in Resources Configuration or enter new CPU and memory values By default, this application is limited to use no more than 4 CPU cores and 8 Gigabytes available memory. The application might use considerably less system resources.
To customize the CPU and memory allocated to the container (pod) Prometheus uses, enter new CPU values as a plain integer value followed by the suffix m (milli). Default is 4000m.
Accept the default value 8Gi allocated memory or enter a new limit in bytes. Enter a plain integer followed by the measurement suffix, for example 129M or 123Mi.


