TrueNAS SCALE Nightly Development Documentation
This content follows experimental early release software. Use the Product and Version selectors above to view content specific to a stable software release.
Netdata
7 minute read.
Last Modified 2024-06-11 10:49 EDTThe TrueNAS SCALE Netdata app provides an easy way to install and access the Netdata infrastructure monitoring solution. SCALE deploys the Netdata app in a Kubernetes container using the Helm package manager. After successfully deploying the app, you can access the Netdata web portal from SCALE. The Netdata web portal opens on the local dashboard, and where you can create new dashboards, add plugins, metric databases, physical and virtual systems, containers, and other cloud deployments you want to monitor. The portal also provides access to the Netdata Cloud sign-in screen.
Application maintenance is independent from TrueNAS SCALE version release cycles. App versions, features, fields, and install behavior at the time of access might vary from those in documented tutorials, especially for legacy version documentation that no longer receives active updates.
We welcome community contributions to keep this documentation current! Click Edit Page in the top right corner to propose changes to this article. See Updating Content for more information.
The SCALE Netdata app does not require advance preparation.
You can allow SCALE to automatically create storage volumes for the Netdata app or you can create specific datasets to use for configuration, cache, and library storage and extra storage volumes in the container pod. If using specific datasets, create these before beginning the app installation.
The administrator account must have sudo permissions enabled. To verify, go to Credentials > Local User. Click on the administrator user (e.g., admin), then click Edit. Scroll down to the sudo permissions. Select either Allow all sudo commands to permit changes after entering a password (not recommended in this instance) or Allow all sudo commands with not password to permit changes without requiring a password. If you upgraded from Angelfish or early releases of Bluefin that do not have an admin user account, see Creating an Admin User Account for instructions on correctly creating an administrator account with the required permissions.
You can create a Netdata account before or after installing and deploying the Netdata app.
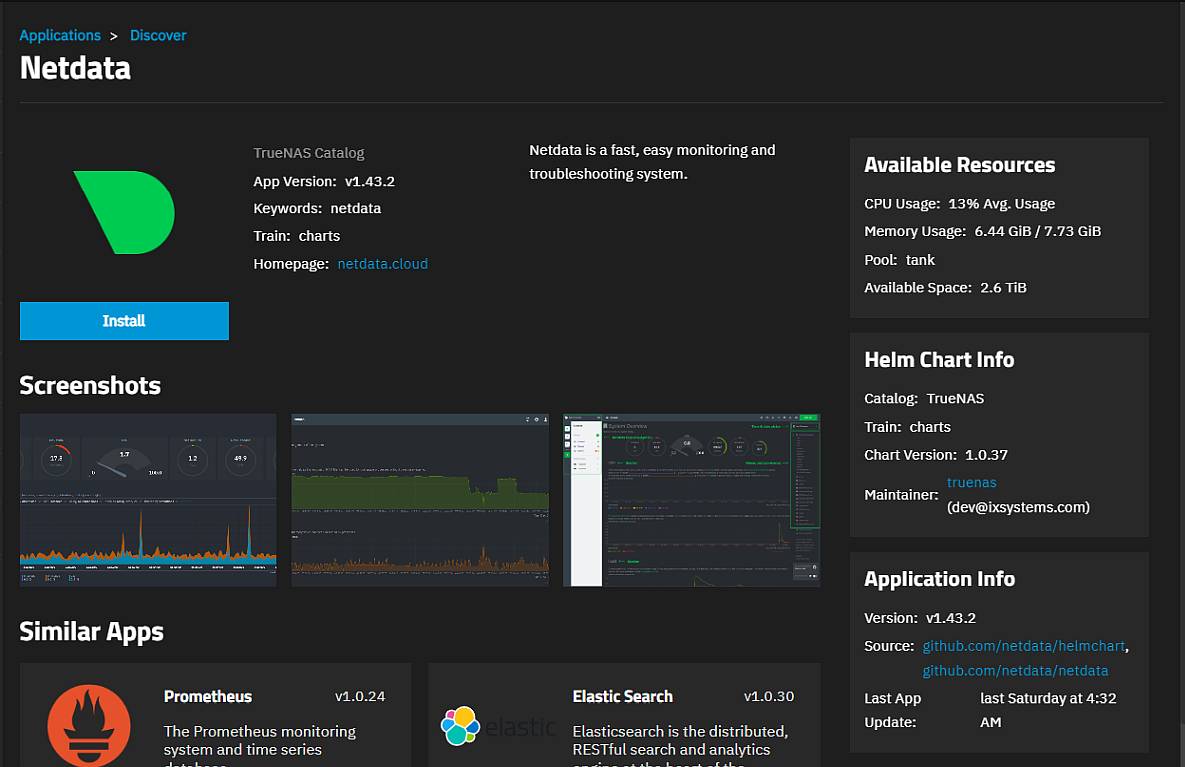
To install the Netdata application, go to Apps, click on Discover Apps, then either scroll down to the Netdata app widget or begin typing Netdata in the search field to filter the list to find the Netdata app widget.
Click on the widget to open the Netdata application details screen.
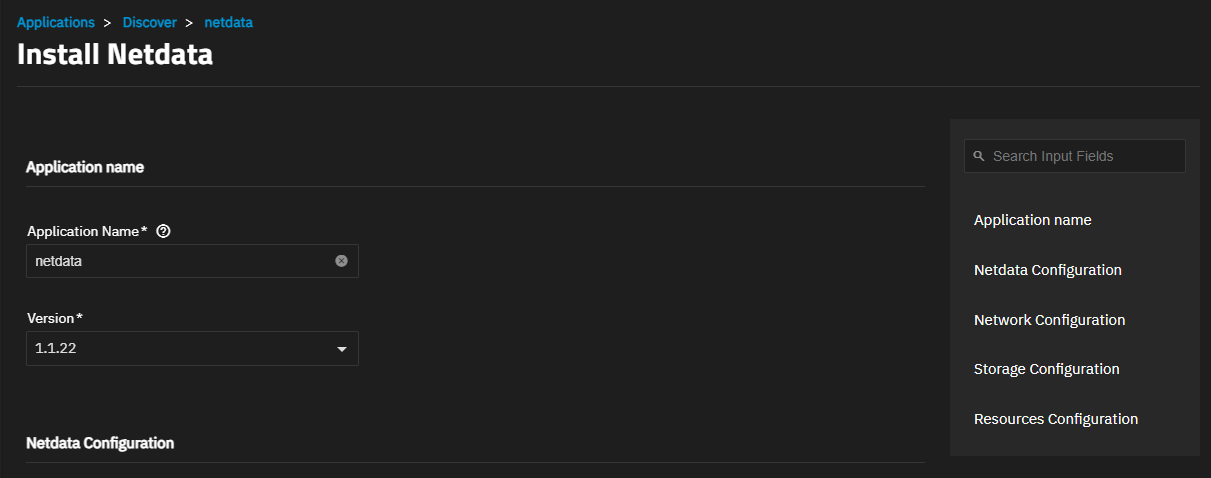
Click Install to open the Install Netdata screen.
Application configuration settings presented in several sections, are explained in Understanding Netdata Settings below. To find specific fields click in the Search Input Fields search field, scroll down to a particular section or click on the section heading on the navigation area in the upper-right corner.
Accept the default values in Application Name and Version.
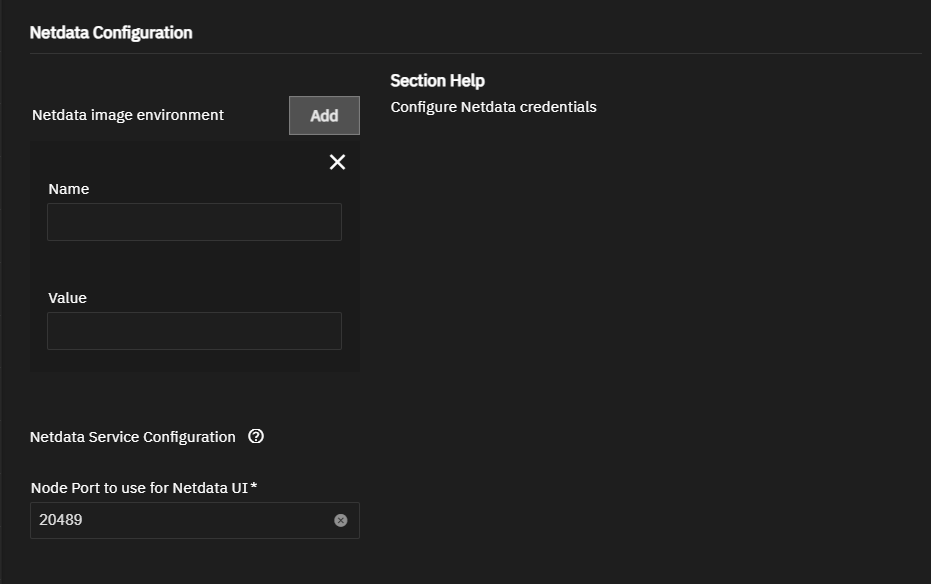
Accept the default settings in Netdata Configuration and the default port in Node Port to use for Netdata UI. The SCALE Netdata app uses the default port 20489 to communicate with Netdata and show the Netdata local dashboard.
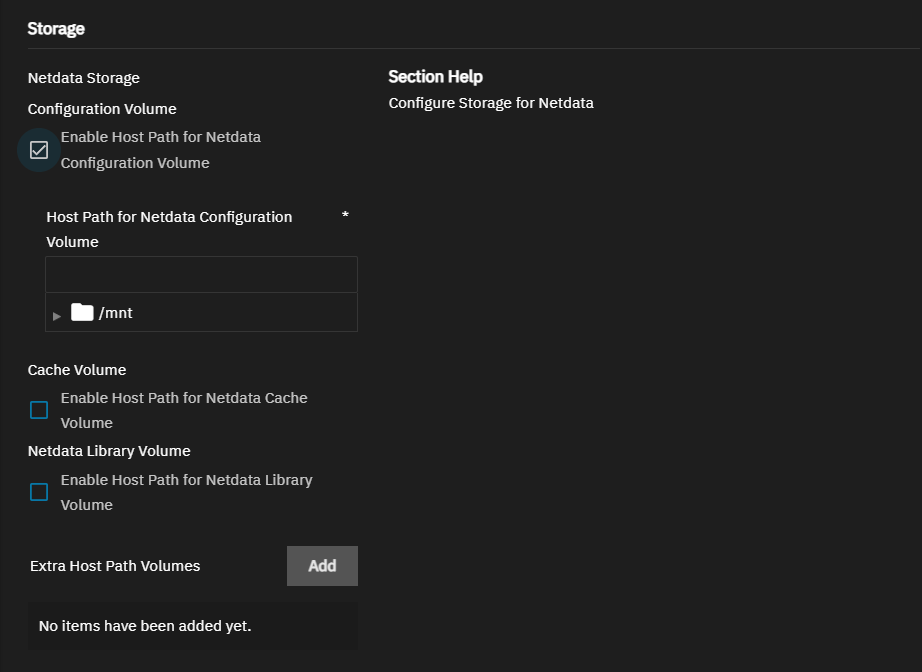
Make no changes in the Storage section to allow SCALE to create the storage volumes for the app, or to use datasets created for Netdata configuration storage, select Enable Host Path for Netdata to show the Host Path for Netdata Configuration settings.
Enter or browse to select the dataset created for Netdata configuration storage to populate the mount path. If using datasets created for cache and library storage, enable these options, then enter or browse to the datasets for each.
Accept the default settings in Advanced DNS Settings.
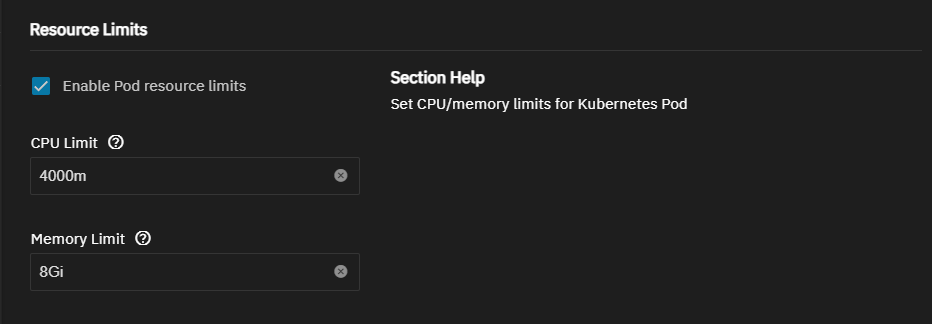
Accept the default values in Resources Limits or select Enable Pod Resource limits to show resource configuration options for CPU and memory and enter new values to suit your use case.
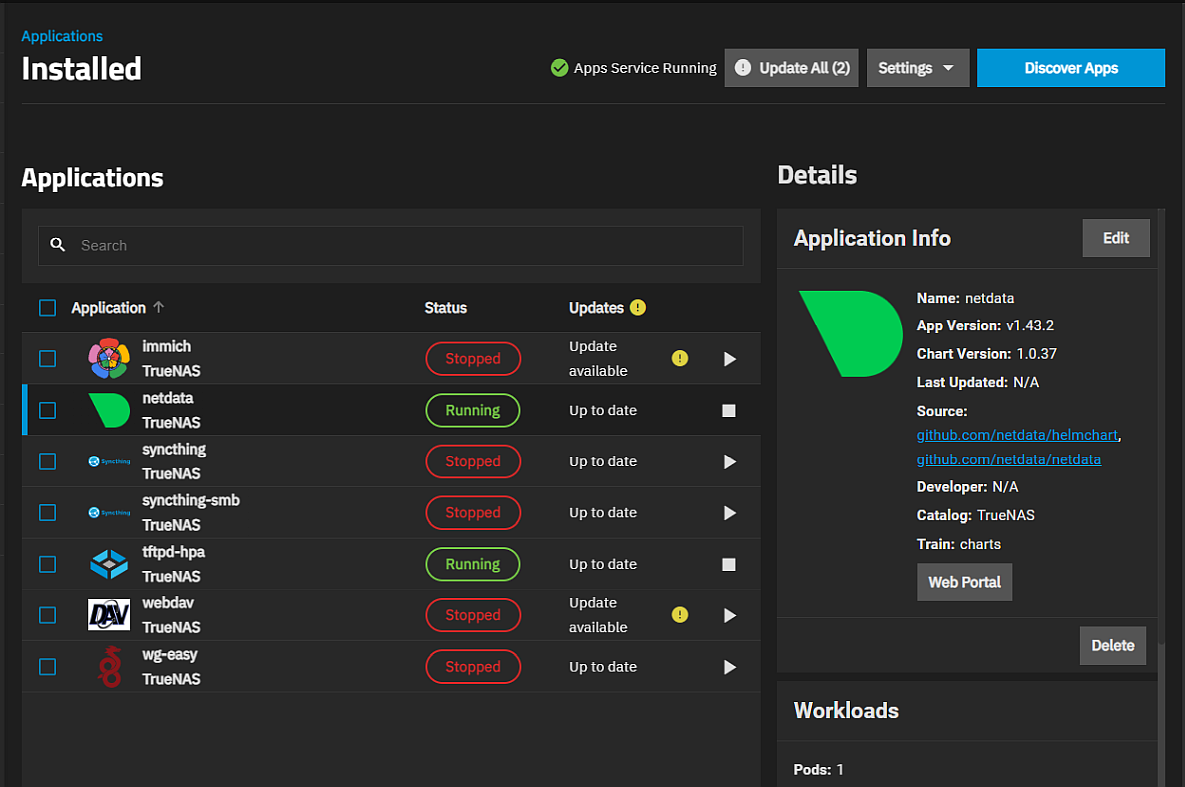
Click Install. The system opens the Installed Applications screen with the Netdata app in the Deploying state. When the installation completes it changes to Running.
Click Web Portal on the Application Info widget to open the Netdata web interface showing the local dashboard.
The following sections provide more detailed explanations of the settings found in each section of the Install Netdata screen.
Accept the default value or enter a name in Application Name. In most cases use the default name, but if adding a second deployment of the application you must change the name.
Accept the default version number in Version. When a new version becomes available, the application shows an update badge on the Installed Applications screen and adds Update buttons to the Application Info widget and the Installed applications screen.
You can accept the defaults in the Netdata Configuration settings or enter the settings you want to use.
Click Add to the right of Netdata image environment to display the environment variable Name and Value fields. Netdata does not require using environment variables to deploy the application but you can enter any you want to use to customize your container.
The SCALE Netdata app uses port 20489 to communicate with Netdata and open the web portal. Netdata documentation states it uses 19999 as the default port, but it recommends restricting access to this for security reasons. Refer to the TrueNAS default port list for a list of assigned port numbers. To change the port numbers, enter a number within the range 9000-65535.
SCALE defaults to automatically creating storage volumes for Netdata without enabling the host path options.
To create and use datasets for the Netdata configuration, cache, and library storage or extra storage volumes inside the container pod, first create these datasets. Go to Datasets and create the datasets before you begin the app installation process. See Add Datasets for more information. Select Enable Host Path for Netdata to show the volume mount path field to add the configuration storage dataset.
Enter or browse to select the dataset and populate the mount path field. To use datasets created for cache and library storage volumes, first enable each option and then enter or browse to select the datasets tp populate the mount path fields for each.
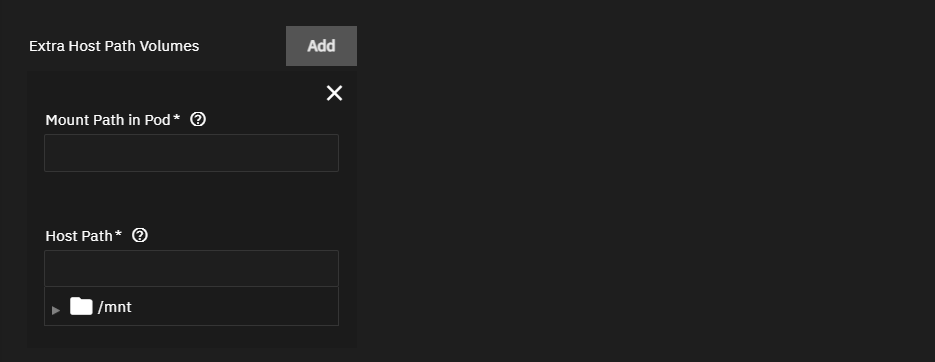
If you want to add storage volumes inside the container pod for other storage, click Add to the right of Extra Host Path Volumes for each storage volume (dataset) you want to add.
You can add extra storage volumes at the time of installation or edit the application after it deploys. Stop the app before editing settings.
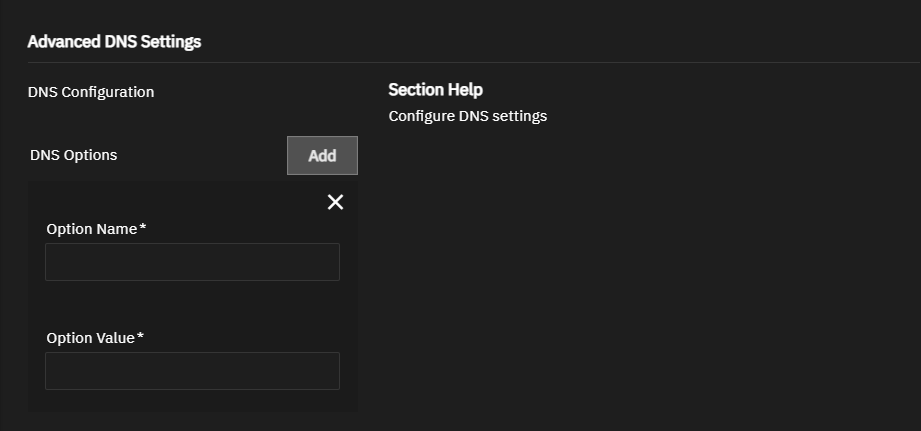
The default DNS Configuration is sufficient for a basic installation. To specify additional DNS options, click Add to the right of DNS Options to add the DNS Option Name and Option Value fields.
Accept the default values in Resources Limits or select Enable Pod Resource limits to show CPU and memory resource configuration options.
By default, the application is limited to use no more than four CPU cores and eight gigabytes available memory. The application might use considerably less system resources.
To customize the CPU and memory allocated to the container (pod) Netdata uses, enter new CPU values as a plain integer value followed by the suffix m (milli). Default is 4000m.
Accept the default value 8Gi allocated memory or enter a new limit in bytes. Enter a plain integer followed by the measurement suffix, for example 129M or 123Mi.
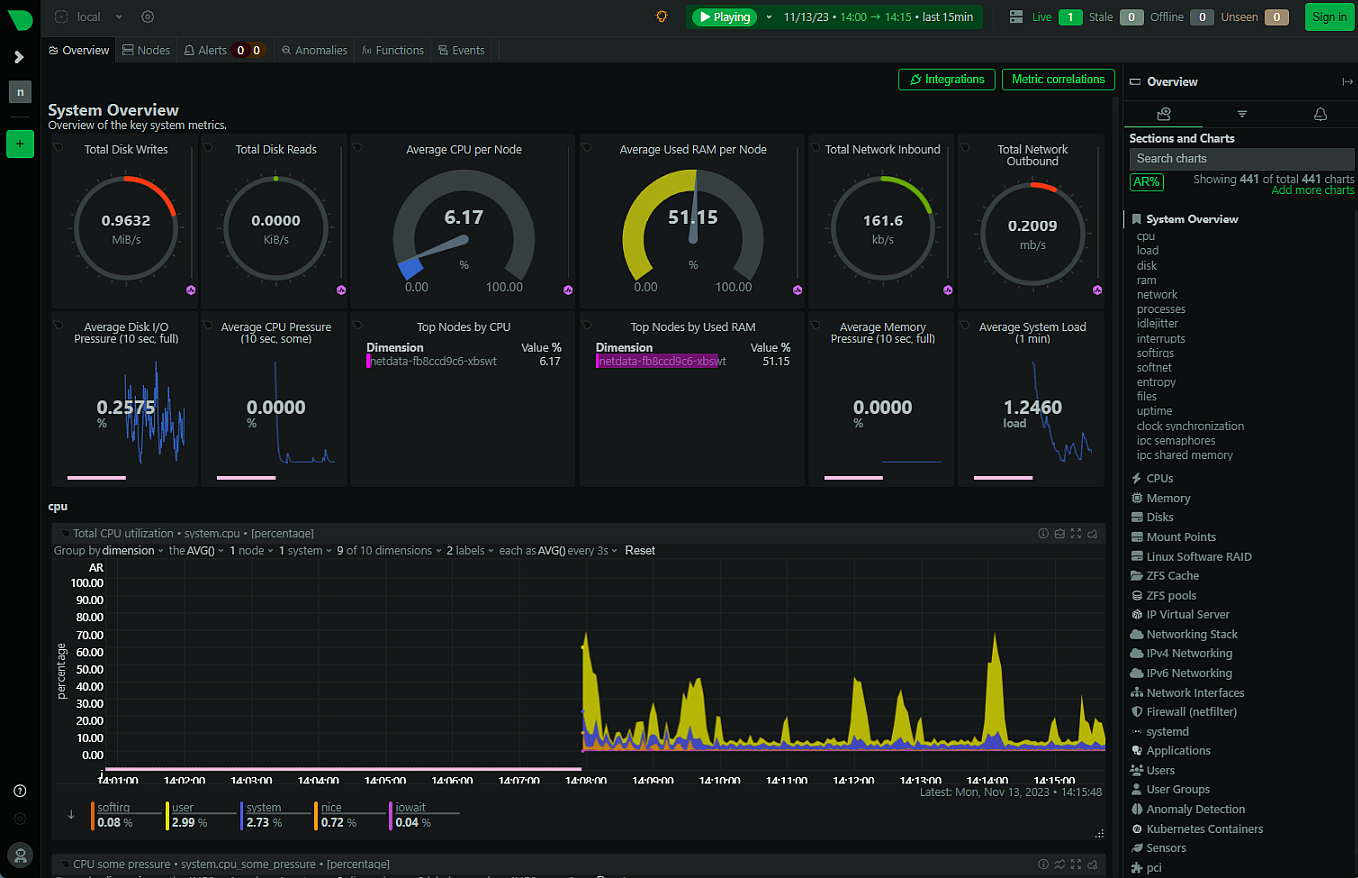
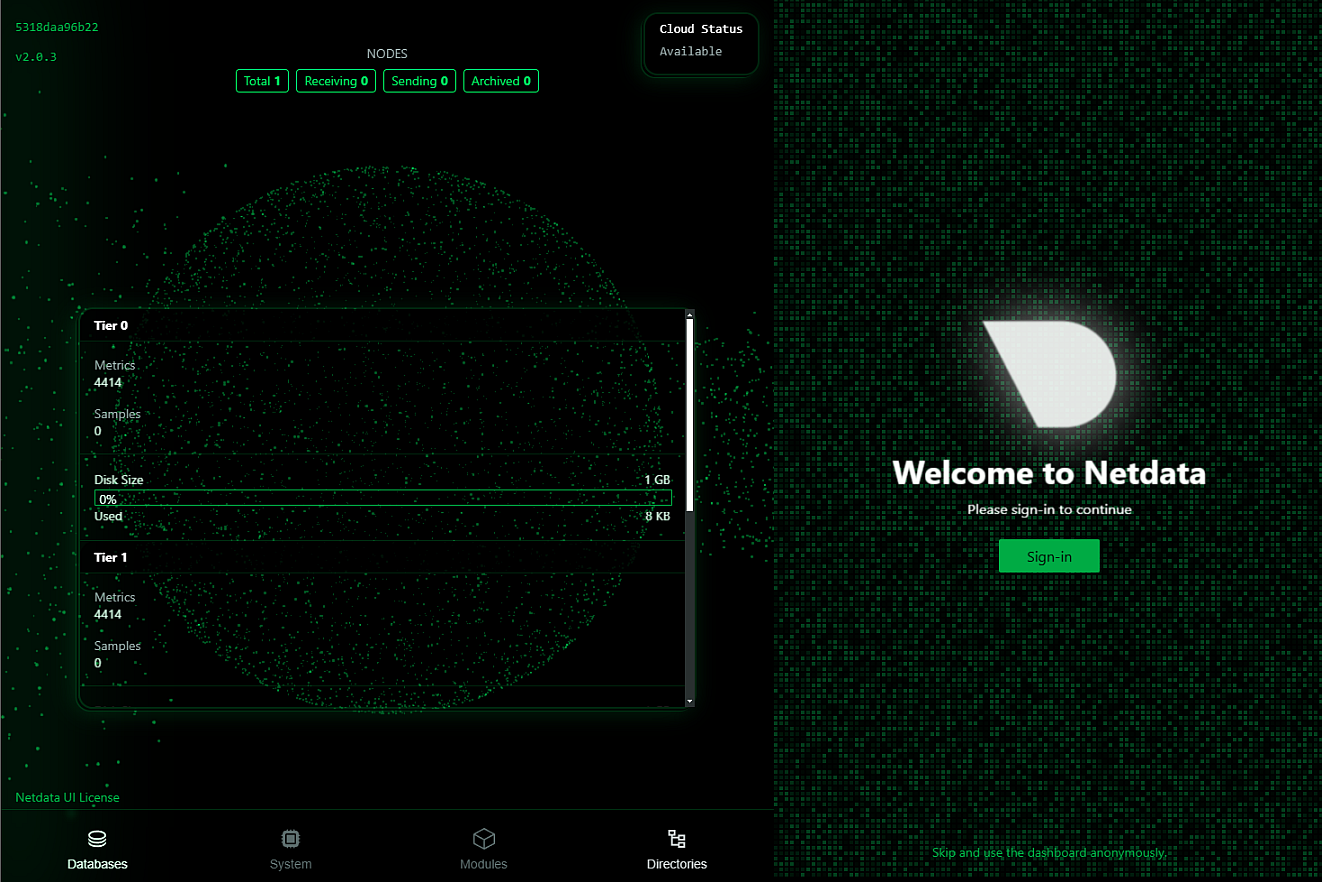
After deploying the SCALE Netdata app click on Web Portal to open the Netdata agent local dashboard. This Netdata dashboard provides a system overview of CPU usage and other vital statistics for the TrueNAS server connecting to Netdata.
The Netdata System Overview dashboard displays a limited portion of the reporting capabilities. Scroll down to see more information or click on a listed metric on the right side of the screen to show the graph and reporting on that metric. Click the other tabs at the top left of the dashboard to view other dashboards for nodes, alerts, anomalies, functions, and events. You can add your own Netdata dashboards using Netdata configuration documentation to guide you. Click on the Nodes tab to better understand the differences between the Netdata agent and Netdata Cloud service reporting. The Netdata Cloud monitors your cloud storage providers added to Netdata.
Click Sign In to open the Netdata Cloud sign-in screen.
Use the Netdata-provided documentation to customize Netdata dashboards to suit your use case and monitoring needs.


