TrueNAS SCALE Documentation Archive
This content follows the TrueNAS SCALE 24.04 (Dragonfish) releases. Archival documentation is provided for reference only and not actively maintained.
Use the Product and Version selectors above to view content specific to different TrueNAS software or major version.
Storage
9 minute read.
The Storage Dashboard screen allows users to configure and manage storage resources such as pools (VDEVs), and disks, and keep the pool healthy (scrub). The dashboard widgets organize functions related to storage resources.
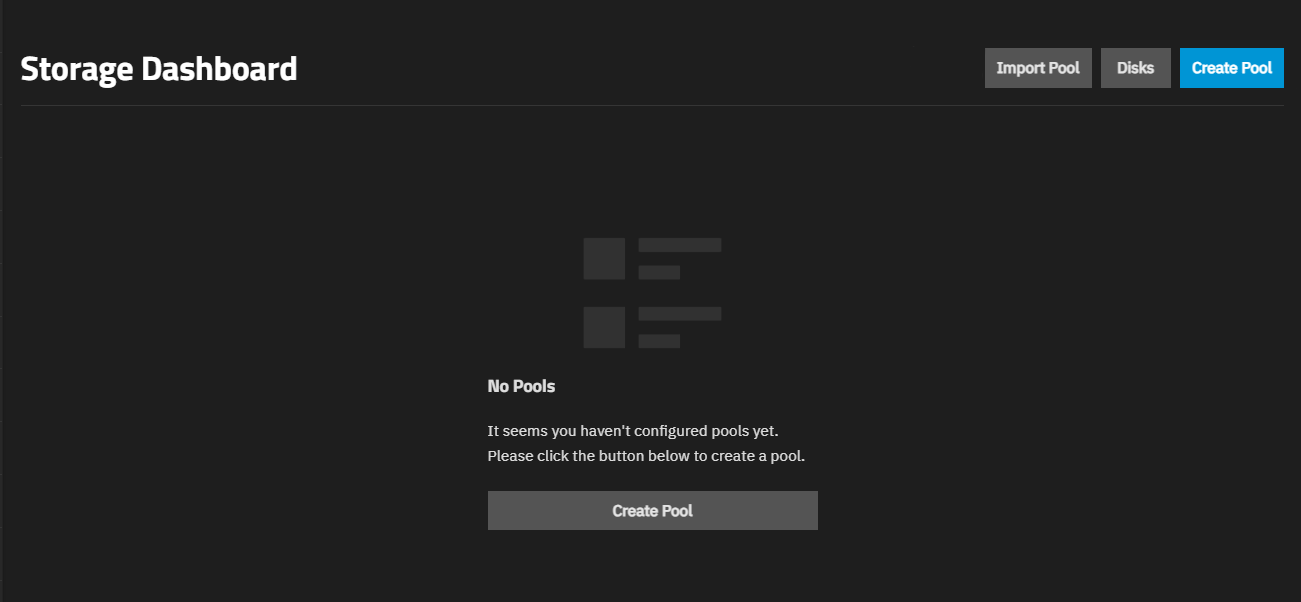
The No Pools screen displays before you add the first pool.
The Create Pool button in the center of the screen opens the Pool Creation Wizard screen.
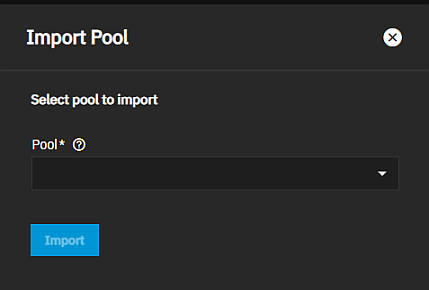
The buttons at the top right of the Storage Dashboard screen provide access to pool and disk functions:
Disks opens the Disks screen.
Create Pool opens the Pool Creation Wizard.
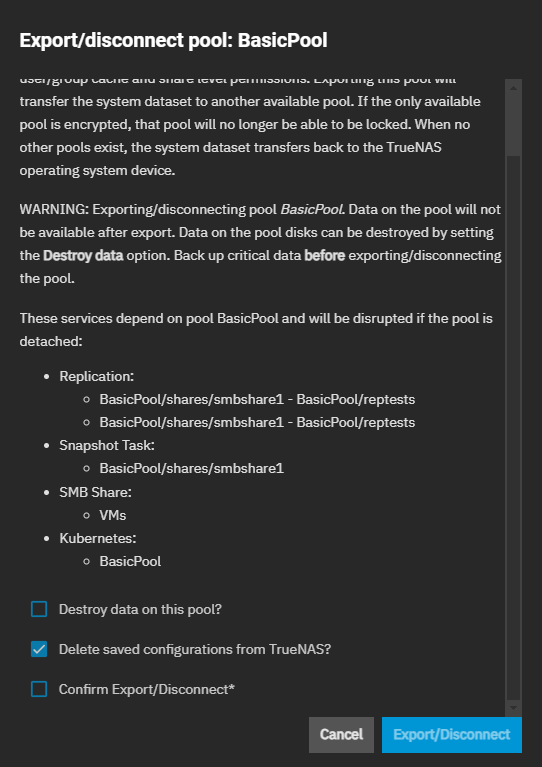
After adding pools, the dashboard shows storage widgets and two more buttons.
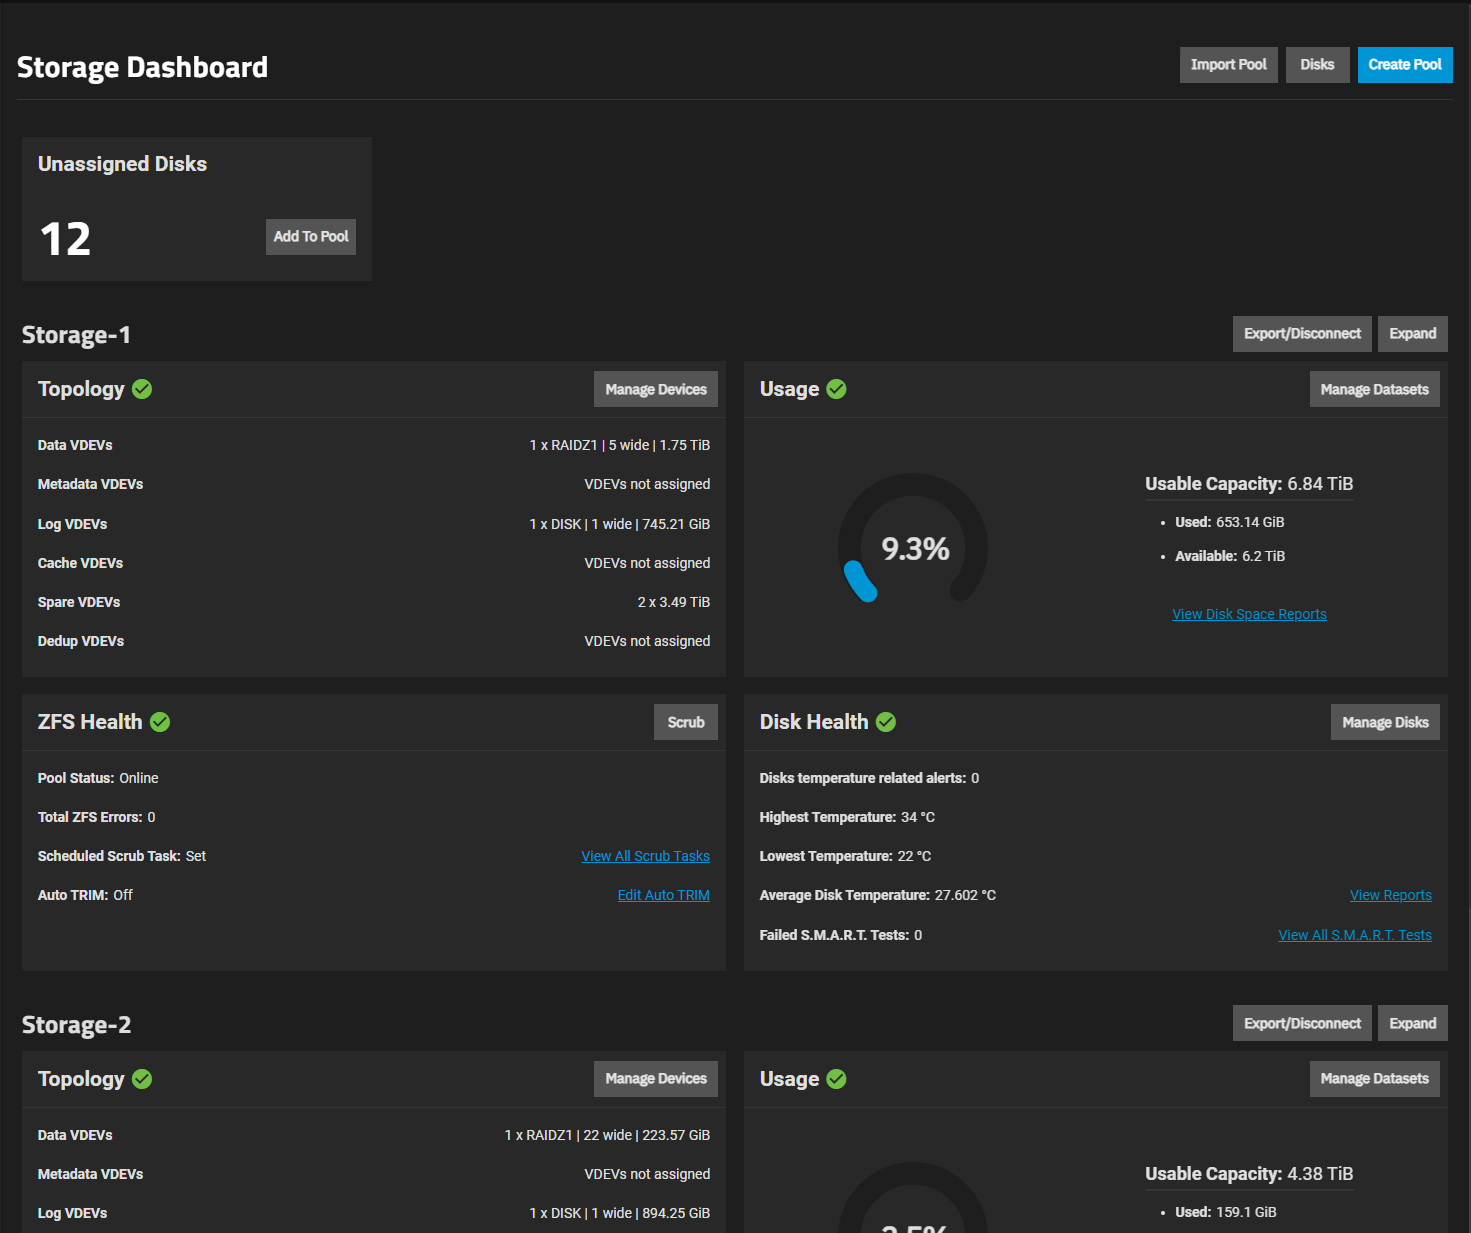
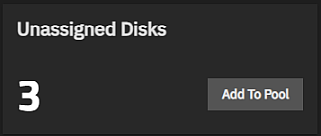
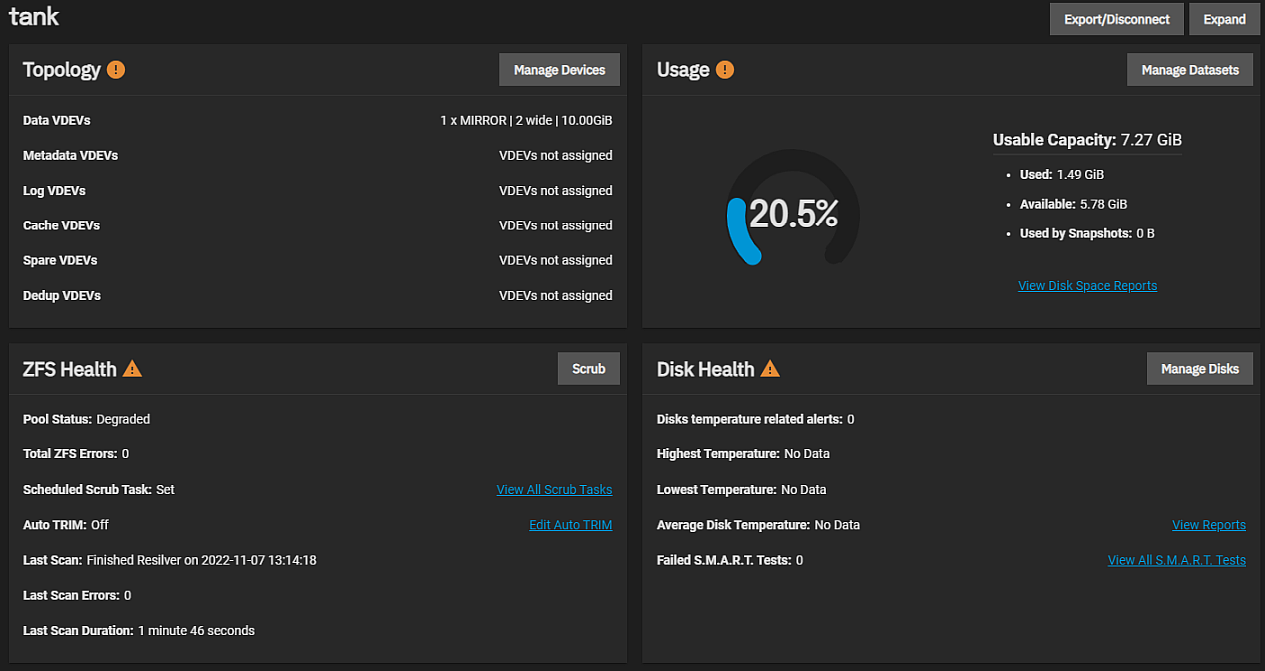
After adding a pool, the screen displays storage widgets. The same set of four widgets and the Export/Disconnect and Expand buttons display for each pool created on the system. The Unassigned Disks widget at the top of the Storage Dashboard only shows when there are disks available to add to a new or existing pool.
Each set of pool widgets provides access to screens for disks, datasets, VDEVs, snapshots, quotas, and pool ZFS functions for the pool. For example, Manage Devices on the Topology widget opens the Devices screen with the VDEVs configured for only that pool.
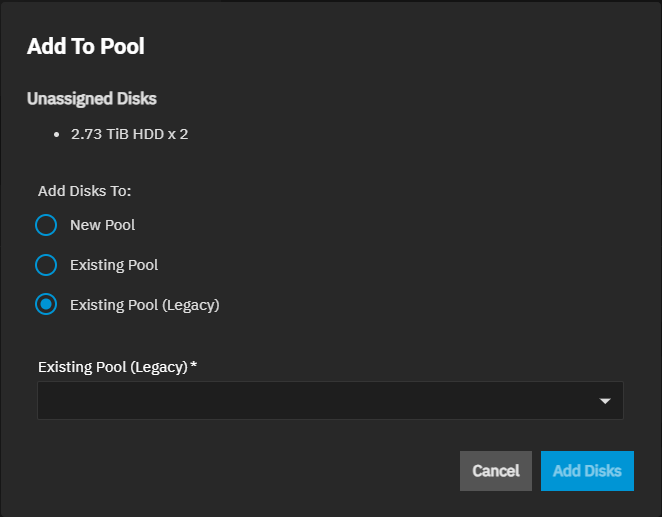
The Unassigned Disks widget displays the number of disks available on your system to use in pools. The disk count includes disks assigned in an exported pool. If you attempt to use a disk assigned in an exported pool, a warning message displays that prompts you to select a different disk.
To see information on each disk on the system, click Manage Disks on the Disk health widget.
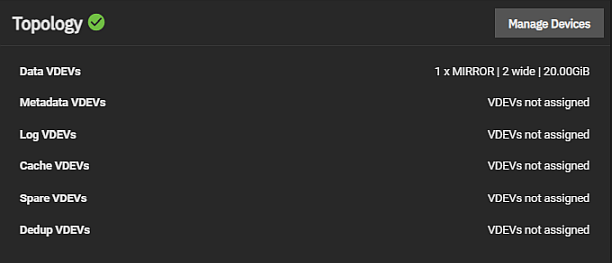
The Topology widget shows information on the VDEVs configured on the system and the status of the pool.
The widget lists each VDEV type (data, metadata, log, cache, spare, and dedup). A Data VDEV includes the data type (stripe, mirror, RAID, or mixed configuration), the number of disks (wide), and the storage capacity of that VDEV.
Manage Devices opens the Devices screen where you can add or manage existing VDEVs.
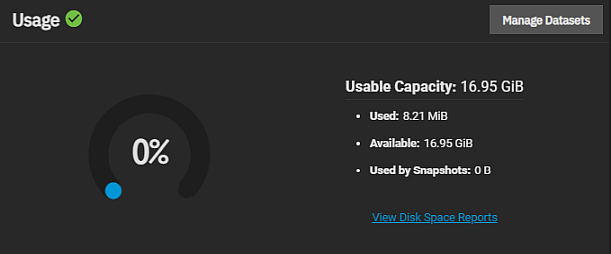
The Usage widget shows information on the space datasets consume in the pool and the status of pool usage.
The widget includes a color-coded donut chart that illustrates the percentage of space the pool uses. Blue indicates space usage in the 0-80% range and red indicates anything above 80%. A warning displays below the donut graph when usage exceeds 80%.
Usable Capacity details pool space statistics by Used, Available, and Used by Snapshots.
View Disk Space Reports opens the pool usage reports for the pool.
Large (>1 petabyte) systems could report storage numbers inaccurately. Storage configurations with more than 9,007,199,254,740,992 bytes round the last 4 digits. For example, a system with 18,446,744,073,709,551,615 bytes reports the number as 18,446,744,073,709,552,000 bytes.
Manage Datasets opens the Datasets screen.
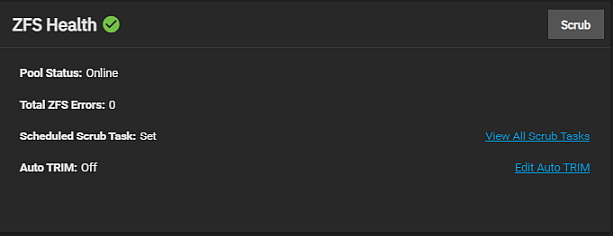
The ZFS Health widget shows information on the health of the pool.
Widget details include:
- Pool Status as online or offline
- Total ZFS Errors as a count of the number of ZFS errors
- Scheduled Scrub Task as set or not
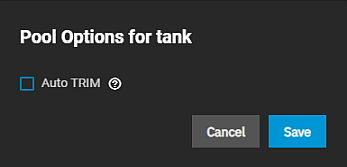
- Auto TRIM as on or off
View all Scrub Tasks opens the Data Protections > Scrub Tasks details screen. This lists all scheduled scrub tasks and allows you to add a new or edit an existing task.
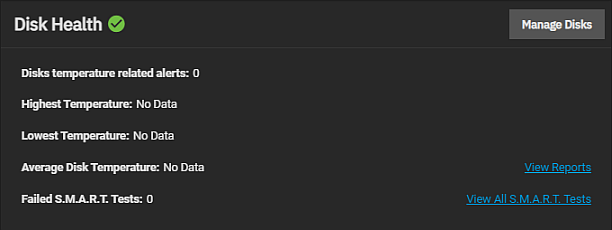
The Disk Health widget shows information on the health of the disks in a pool.
The details on the widget include the non-dismissed disk temperature alerts for highest, lowest, and average temperature, and failed S.M.A.R.T. tests.
Manage Disks opens the Storage > Disk screen.
View Reports opens the Report screen for the disks in the selected pool.
View all S.M.A.R.T. Tests opens the Data Protection > S.M.A.R.T. Tests screen.
Each widget in the set of four pool widgets includes a color-coded icon just to the right of the header. This icon indicates the status of the pool as healthy (green checkmark), offline (orange triangle), or in a warning state (purple warning sign).
This same information displays on both the Storage widget and a pool widget you can add to the Dashboard.
The Storage Dashboard shows the Upgrade button for existing pools after an upgrade to a new TrueNAS release that includes new OpenZFS feature flags. Newly created pools are always up to date with the OpenZFS feature flags available in the installed TrueNAS release.
Storage pool upgrades are typically not required unless the new OpenZFS feature flags are deemed necessary for required or improved system operation. Consider these factors before upgrading a storage pool to the latest OpenZFS feature flags.
Upgrading can affect data. Before performing any operation that affects data on a storage disk, always back up data first and verify the backup integrity.
New OpenZFS feature flags are permanently applied to the upgraded pool. An upgraded pool cannot be reverted or downgraded to an earlier OpenZFS version. A storage pool with the latest feature flags cannot import into another operating system that does not support those feature flags.
Upgrading a ZFS pool is optional. Do not upgrade the pool when reverting to an earlier TrueNAS version or repurposing the disks in another operating system that supports ZFS is a requirement.
The upgrade itself only takes a few seconds and is non-disruptive. It is not necessary to stop any sharing services to upgrade the pool. However, it is best to upgrade when the pool is not in heavy use. The upgrade process suspends I/O for a short period but is nearly instantaneous on a quiet pool.
- Disks: Describes UI screens and dialogs related to disk operations.
- Pool Creation Wizard: Descriptions for settings and functions found in the Pool Creation Wizard.
- Devices: Provides information on settings and functions found on the Devices screens and widget.


