TrueNAS SCALETrueNAS SCALE Version Documentation
This content follows the TrueNAS SCALE 23.10 (Cobia) releases. Use the Product and Version selectors above to view content specific to different TrueNAS software or major version.

Reporting Screens

  5 minute read.

Last Modified 2024-04-24 14:31 EDT

The Reporting screen displays graphs of system information for CPU, disk, memory, network, NFS, partition, target, UPS, ZFS, and system functions. Use the dropdown in the upper right corner to select between reporting graph display options. The CPU report displays by default.

TrueNAS SCALE uses Netdata to gather metrics, create visualizations, and provide reporting statistics.

To configure third party reporting integration, such as Graphite, click Exporters to open the Reporting Exporters screen.

Reporting Screen Display Options

SettingDescription
CPUDisplays the CPU Temperature, CPU Usage, and System Load graphs.
DiskDisplays graphs for each selected system disk and by report type.
MemoryDisplays both the Physical memory utilization and Swap utilization graphs.
NetworkDisplays an Interface Traffic graph for each interface in the system.
SystemDisplays both the Processes and Uptime graphs.
ZFSDisplays the ARC Size, ARC Hit Ratio, ARC Requests demand_data, ARC Requests demand_metadata, ARC Requests prefetch_data, and ARC Requests prefetch_metadata graphs with the Arc and L2 gigabytes and hits (%), and the hits, misses and total number of requests.

Report Graphs

The following sections provide examples of each report graph.

CPU Graphs

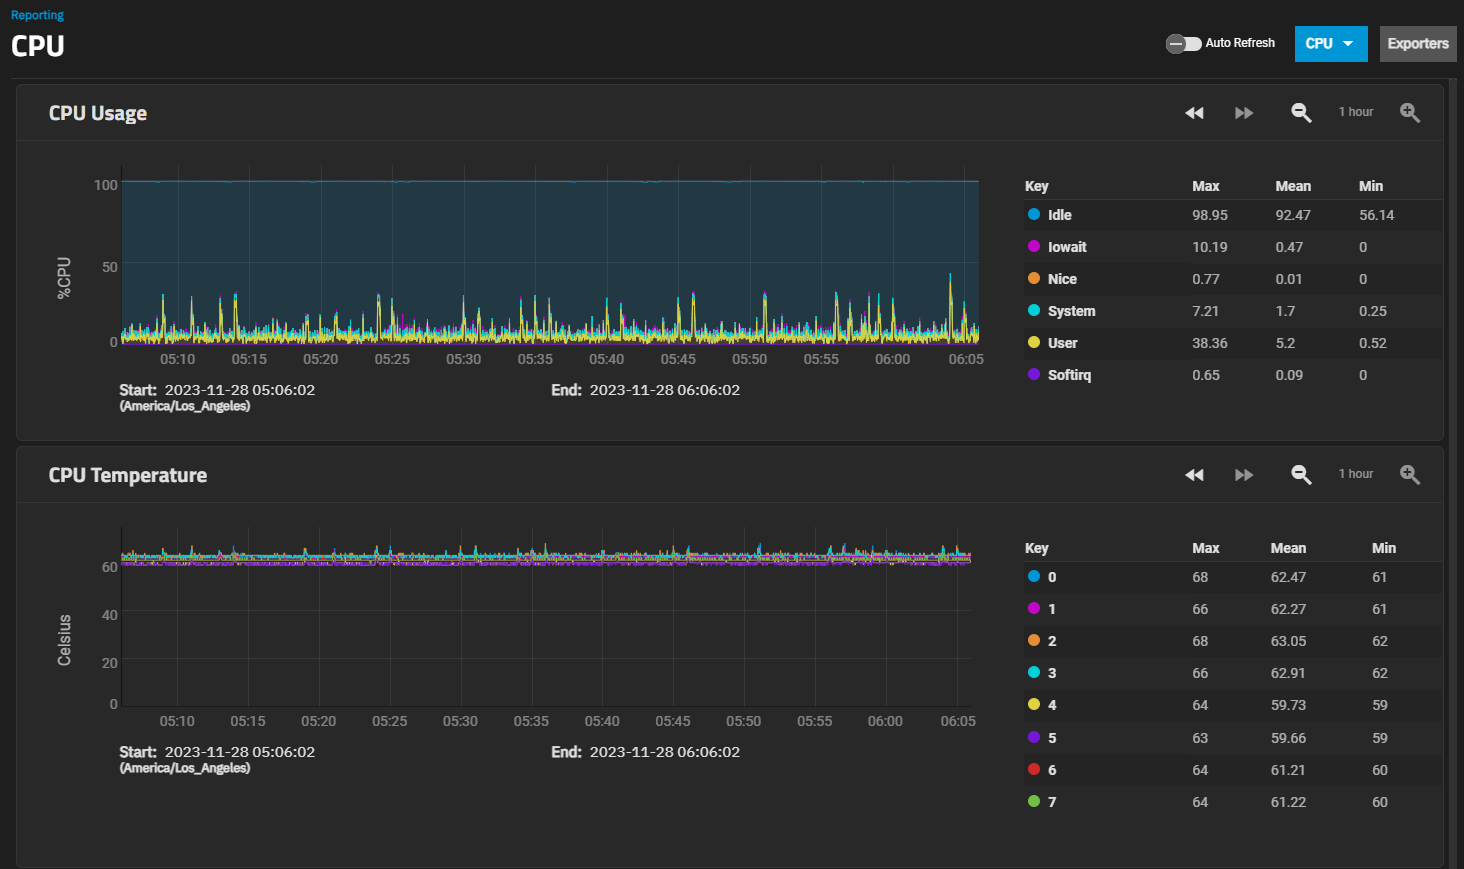
CPU graphs show the amount of time spent by the CPU in various states such as executing user code, executing system code, and being idle. Graphs of short-, mid-, and long-term load are shown, along with CPU temperature graphs.

Disk Graphs

Disk graphs shows read and write statistics on I/O, percent busy, latency, operations per second, pending I/O requests, and disk temperature. Use the Select Disks dropdown list to select the disks and the Select Reports dropdown to select the report types to display.

Disk Report Options

SettingDescription
Select AllDisplays all available graphs for any or all disks selected on the Disks dropdown list.
Disk TemperatureDisplays the minimum, maximum and mean temperature reading for the disk selected.
Disk I/ODisplays the disk read and write I/O stats in bytes/s.
Temperature monitoring for the disk is disabled if HDD Standby is enabled. Check the Storage > Disks Edit Disk* configuration form for any or all disks in the system if you do not see the temperature monitoring graph.

Large petabyte systems may report storage numbers inaccurately. Storage configurations with more than 9,007,199,254,740,992 bytes will round the last 4 digits.

For example, a system with 18,446,744,073,709,551,615 bytes reports the number as 18,446,744,073,709,552,000 bytes.

Memory Graphs

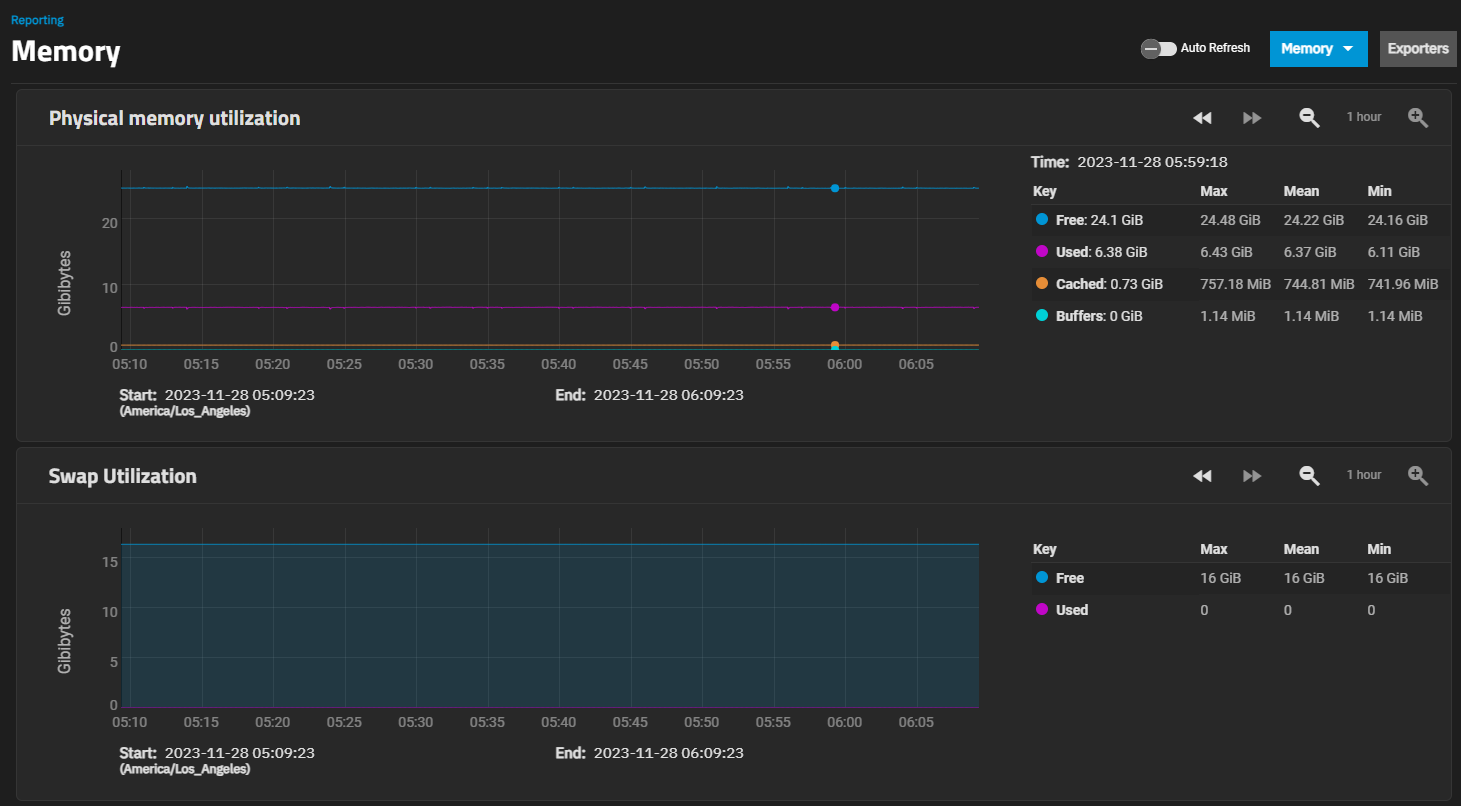
Memory graphs display memory usage and swap graphs display the amount of free and used swap space.

Network Graphs

Network graph report received and transmitted traffic in megabytes per second for each configured interface.

System Graphs

System graphs display the number of processes grouped by state, sleeping, running, stopped, zombies and blocked, and system uptime.

ZFS Graphs

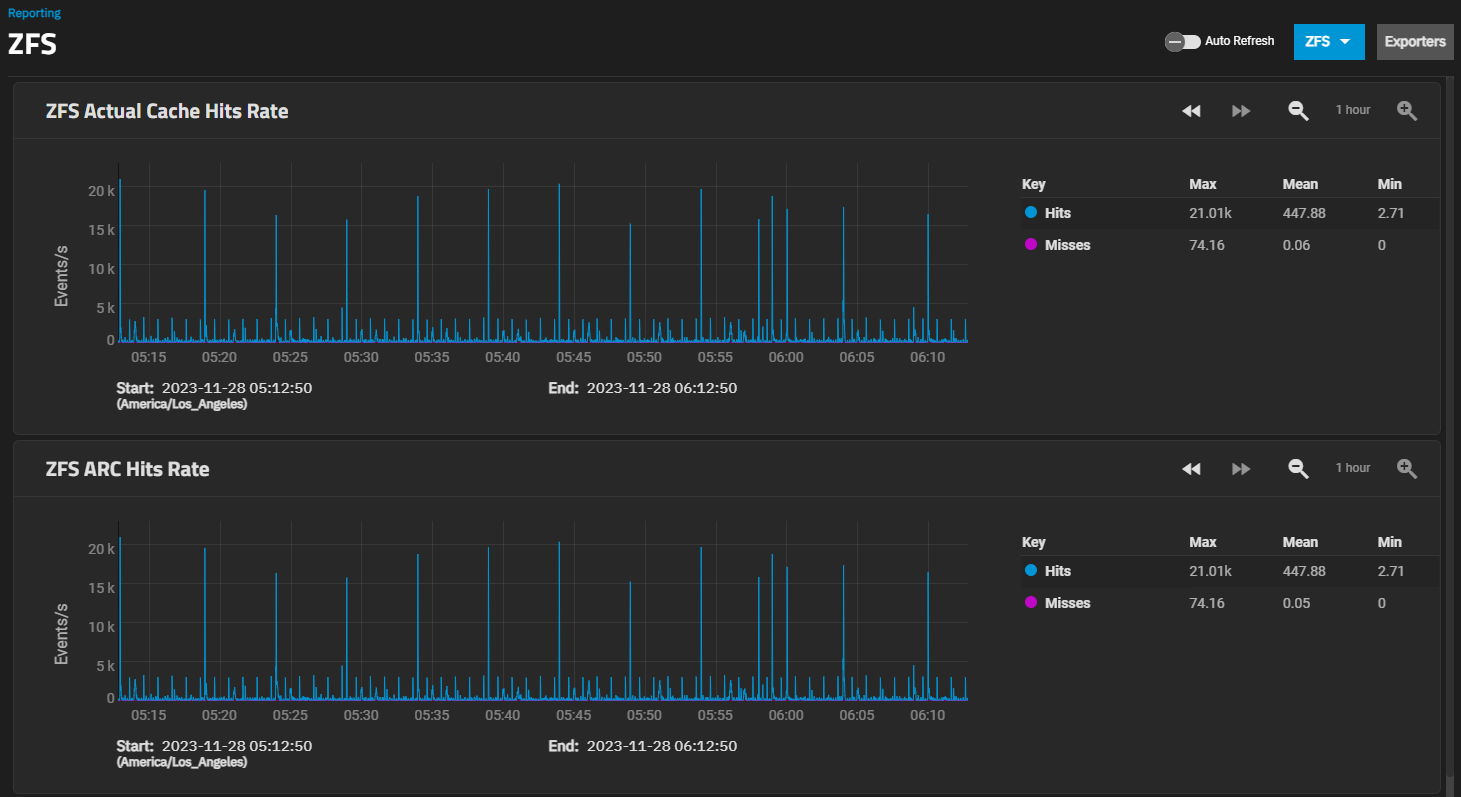
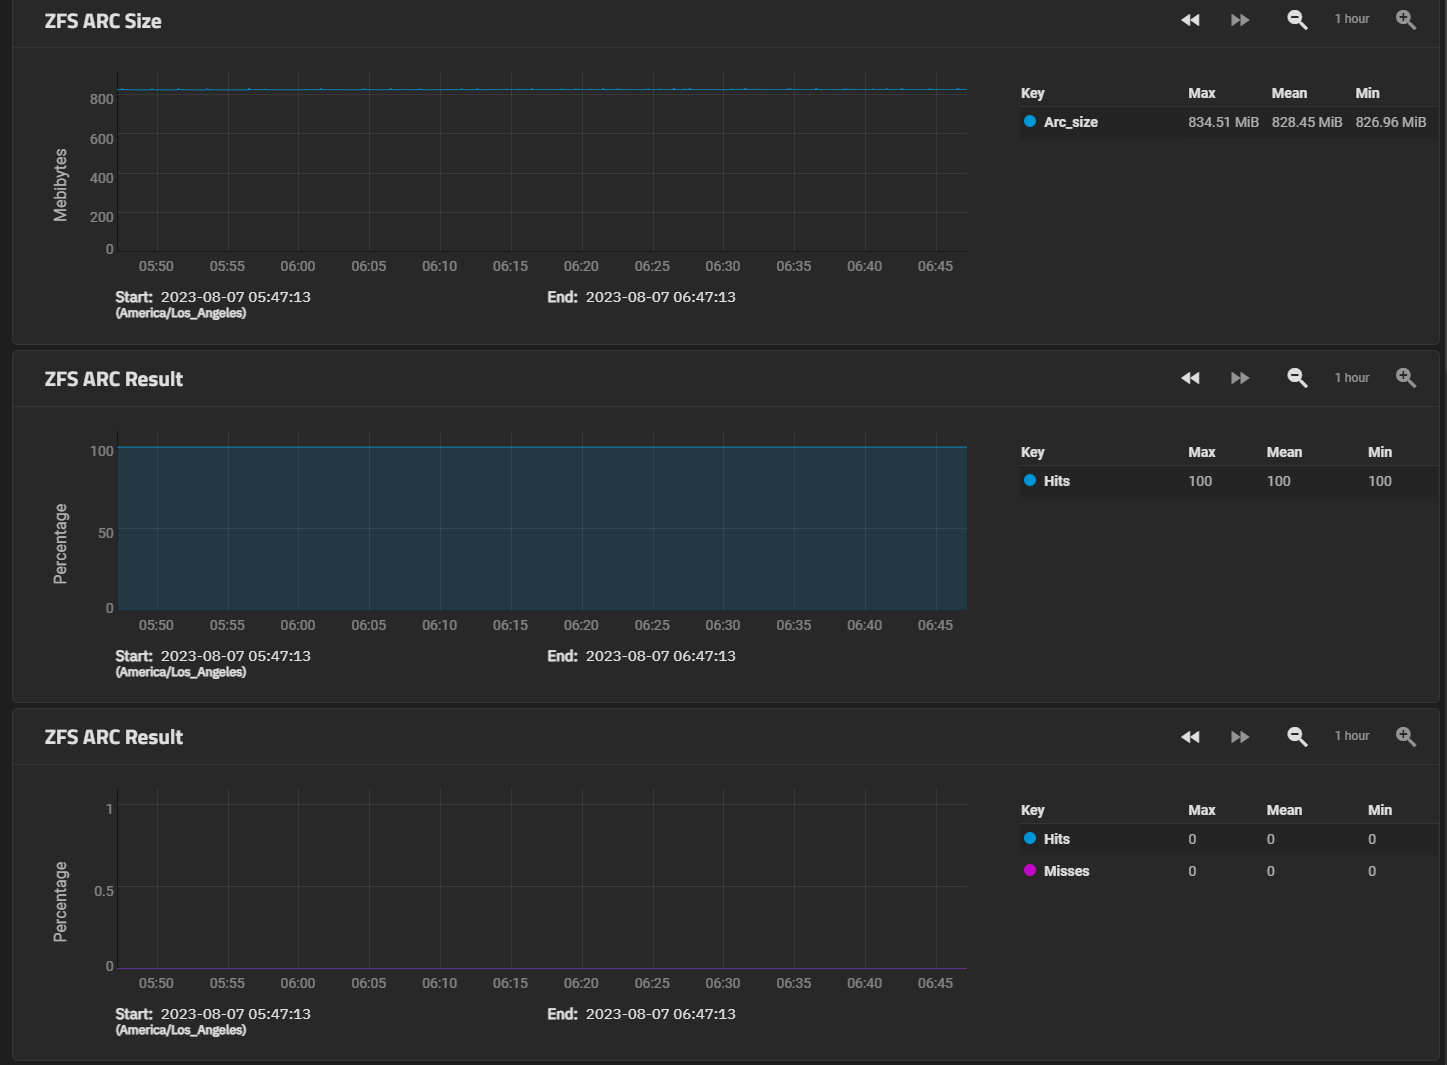
ZFS graphs show compressed physical ARC size, hit ratio, demand data, demand metadata, and prefetch data and metadata.

Reporting Exporters Screen

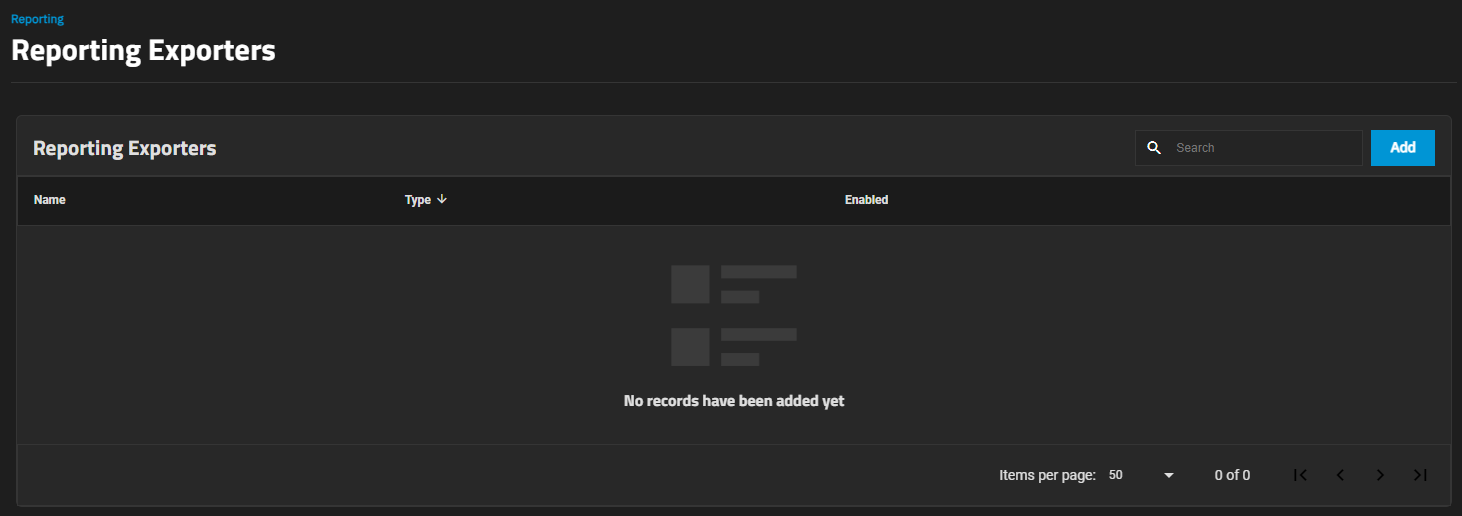
The Reporting Exporters screen displays any configured third party reporting exports on the system. Exporting enables TrueNAS SCALE to send Netdata reporting metrics to another time-series database. For more information, see the Netdata exporting reference guide.

Reporting Exporters Screen
Figure 10: Reporting Exporters Screen

Click Add to open the Add Reporting Exporter screen.

Add Reporting Exporter

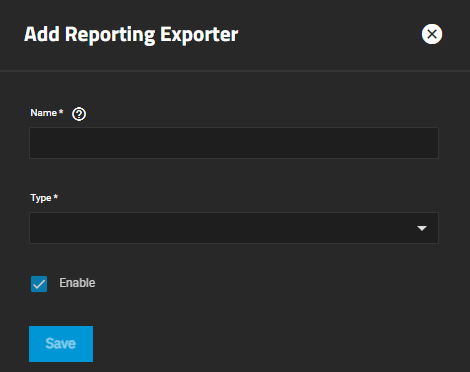
Use the Add Reporting Exporter screen to configure third party reporting integrations.

Add Reporting Exporter
Figure 11: Add Reporting Exporter
SettingDescription
NameEnter a unique name for the exporter configuration. If configuring multiple instances, give each a distinct name.
TypeSelect the exporter type to configure. The only current supported option is GRAPHITE.
EnableSelect to send reporting data to the configured exporter. Leave checkbox clear to disable the explorer without removing configuration.

Additional settings populate based on the selected Type option.

SettingDescription
Destination IpRequired. Enter the IP address of the Graphite server.
Destination PortRequired. Enter the port the Graphite server monitors.
PrefixEnter the prefix to add to all Netdata metrics sent to Graphite. Defaults to dragonfish.
Netdata exports reporting metrics to Graphite in the format prefix.hostname.chart.dimension.
HostnameEnter the host name to add to all metrics sent to the Graphite server. Defaults to truenas.
Update EveryEnter the number of seconds for the interval to send data to the Graphite database. Defaults to 1.
Buffer On FailuresEnter the number of iterations (Update Every seconds) to buffer data, when the Graphite server is not available. Defaults to 10.
Send Names Instead Of IdsEnter true to send Netdata chart and dimension names to Graphite or false to send IDs. Defaults to true.
Matching ChartsEnter one or more space separated patterns in regular expression (use * as wildcard or ! to define a negative match) to specify the charts to send to Graphite. Defaults to * (send all charts).

See Configuring Graphite Exporting for more information.

Related Content