TrueNAS SCALE Documentation Archive
This content follows the TrueNAS SCALE 22.12 (Bluefin) releases. Archival documentation is provided for reference only and not actively maintained.
Use the Product and Version selectors above to view content specific to different TrueNAS software or major versions.
Reporting Screens
4 minute read.
Last Modified 2024-03-19 08:47 EDTThe Reporting screen displays graphs of system information for CPU, disk, memory, network, NFS, partition, target, UPS, ZFS, and system functions. The CPU report displays by default.
The settings opens the Reports Configuration configuration screen.
Reports Configuration settings specify how TrueNAS displays the graphs and the host name of the Graphite server.
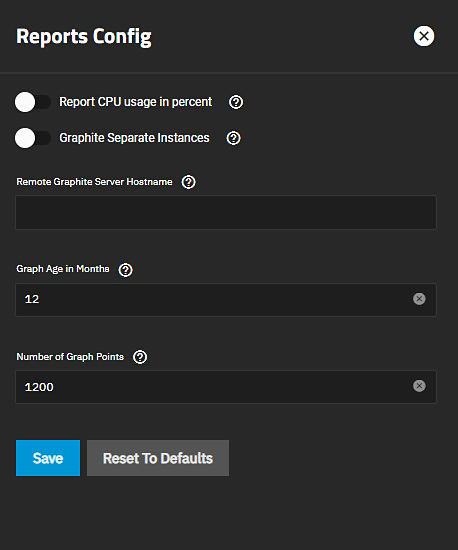
General Options
| Name | Description |
|---|---|
| Report CPU usage in Percent | Reports CPU usage in percent instead of units of kernel time. |
| Graphite Separate Instances | Sends the plugin instance and type instance to Graphite as separate path components: host.cpu.0.cpu.idle. Disabling sends the plugin and plugin instance as one path component and type and type instance as another: host.cpu-0.cpu-idle. |
| Remote Graphite Server Hostname | Remote Graphite server host name or IP address. |
| Graph Age in Months | Maximum time (in months) TrueNAS stores a graph. Allowed values are 1-60. Changing this value causes the Confirm RRD Destroy dialog to display. Changes do not take effect until TrueNAS destroys the existing reporting database. |
| Number of Graph Points | The number of points for each hourly, daily, weekly, monthly, or yearly graph. Allowed values are 1-4096. Changing this value displays the Confirm RRD Destroy dialog. Changes do not take effect until TrueNAS destroys the existing reporting database. |
| Reset to Defaults | Resets all entered values and settings back to defaults. |
| Setting | Description |
|---|---|
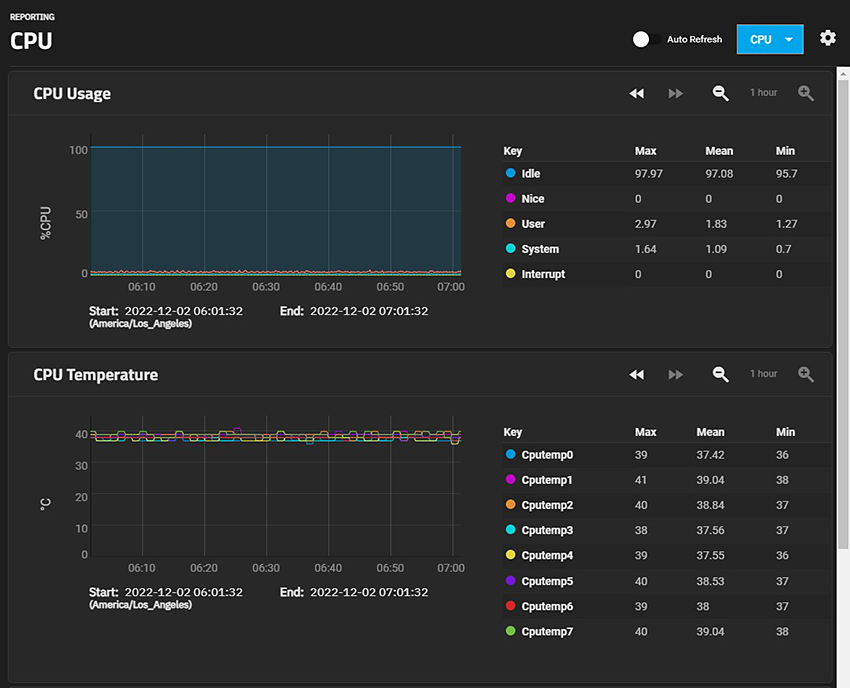
| CPU | Displays the CPU Temperature, CPU Usage, and System Load graphs. |
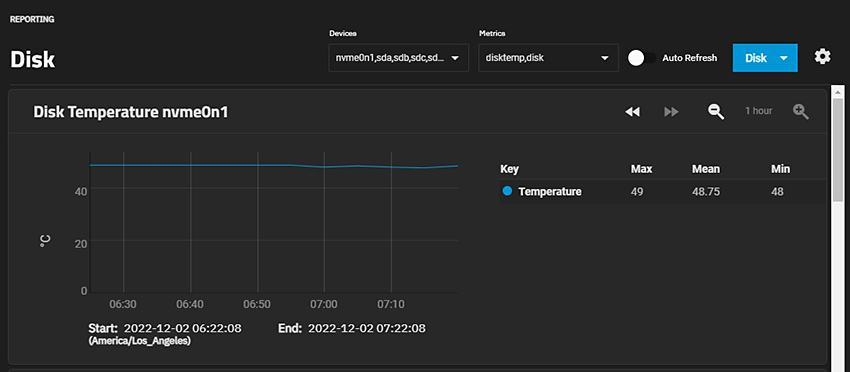
| Disk | Displays graphs for each selected system disk and by report type. |
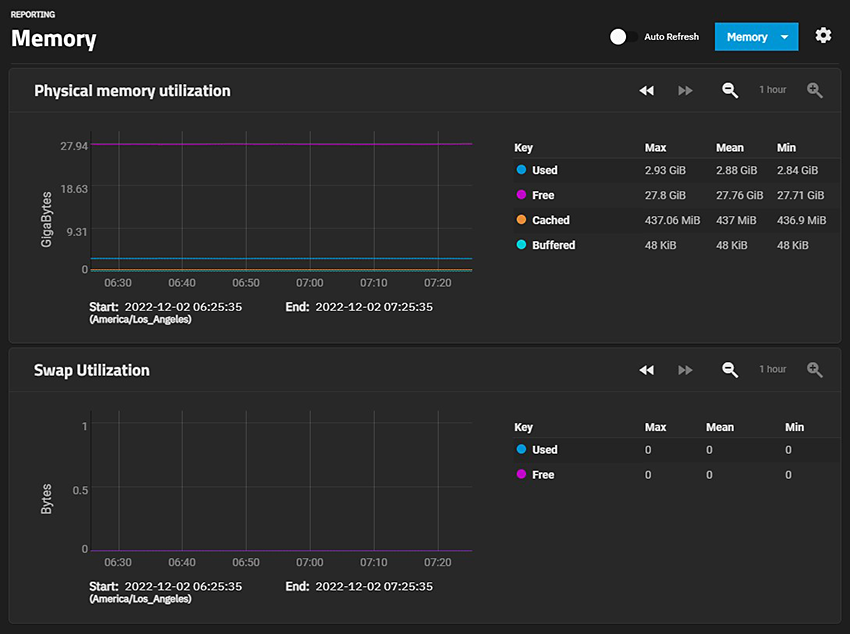
| Memory | Displays both the Physical memory utilization and Swap utilization graphs. |
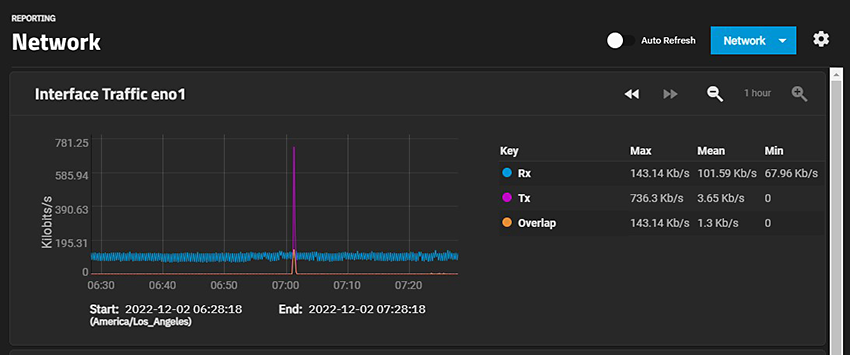
| Network | Displays an Interface Traffic graph for each interface in the system. |
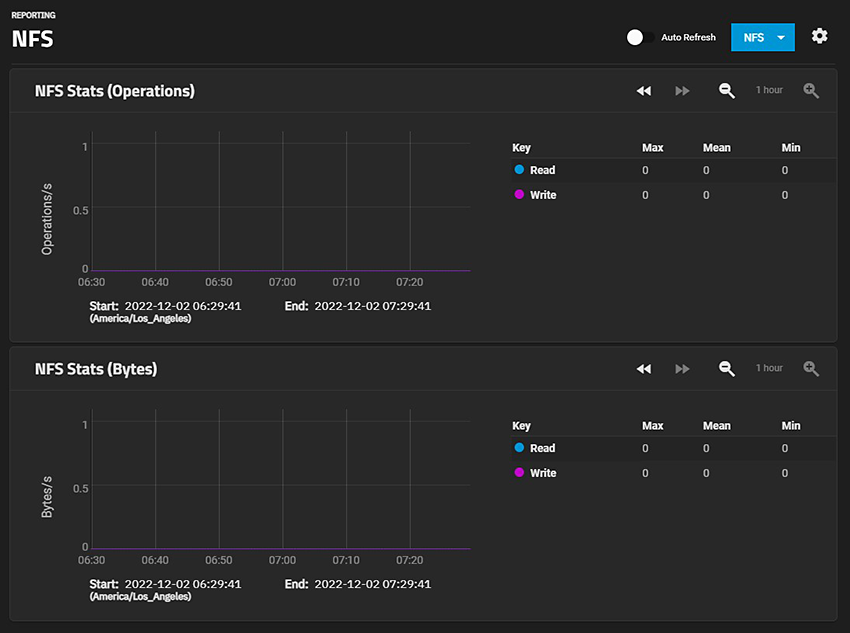
| NFS | Displays the NFS Stats (Operations) and NFS Stats (Bytes) graphs. |
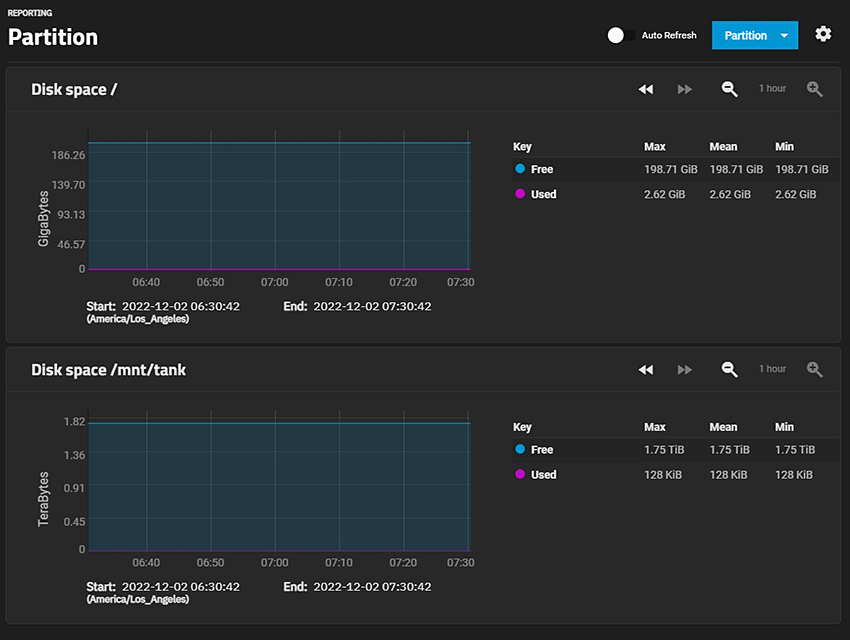
| Partition | Displays graphs showing disk space allocations. |
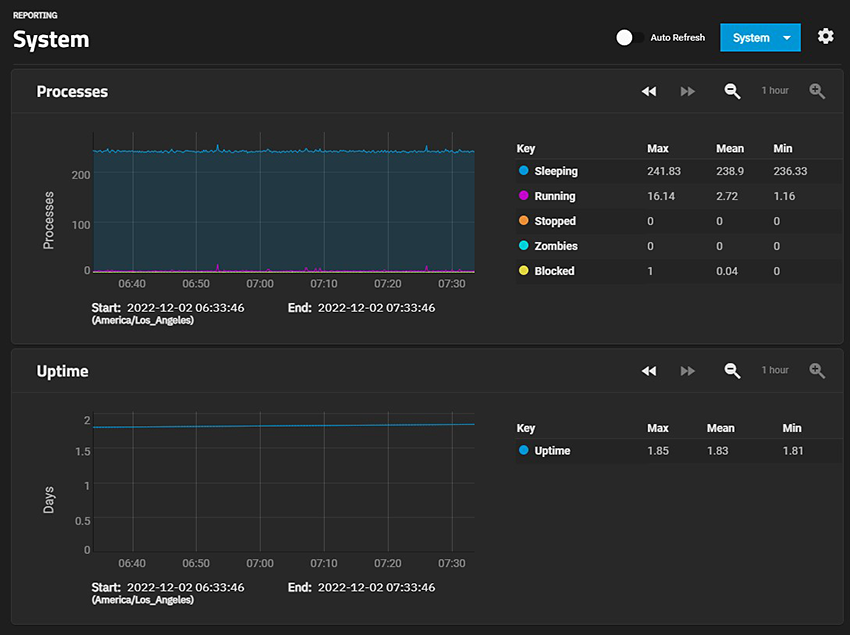
| System | Displays both the Processes and Uptime graphs. |
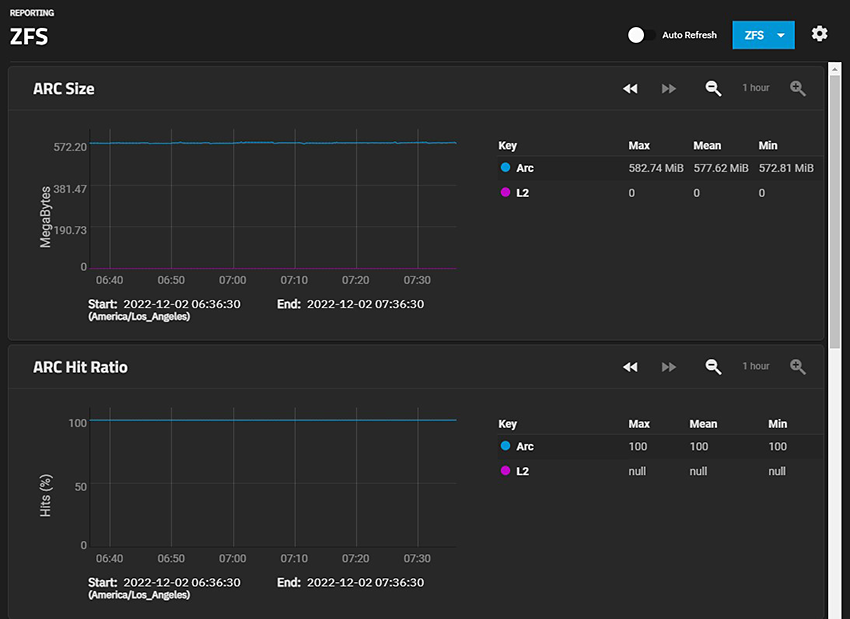
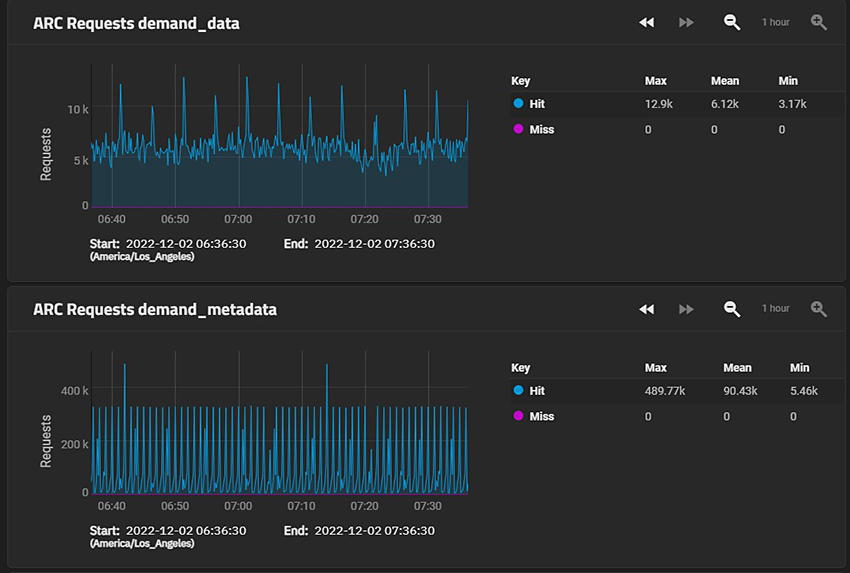
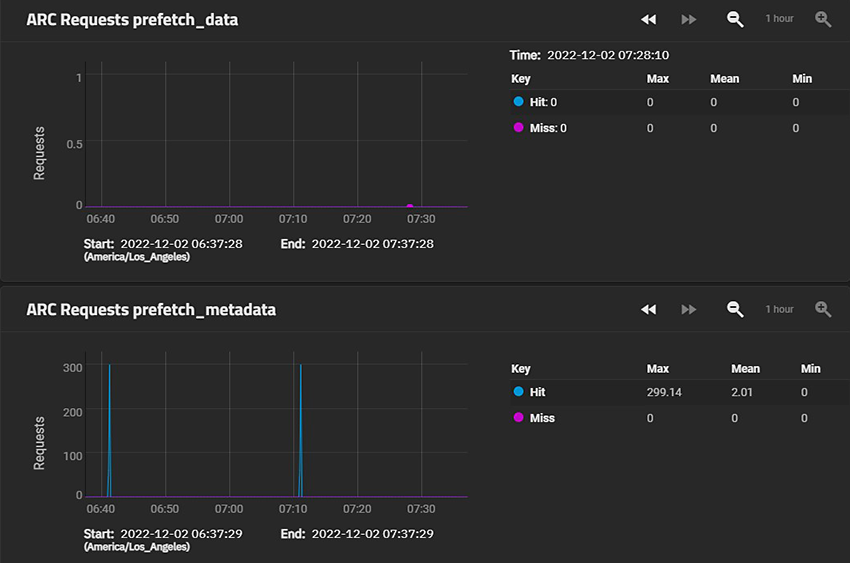
| ZFS | Displays the ARC Size, ARC Hit Ratio, ARC Requests demand_data, ARC Requests demand_metadata, ARC Requests prefetch_data, and ARC Requests prefetch_metadata graphs with the Arc and L2 gigabytes and hits (%), and the hits, misses and total number of requests. |
The following sections provide examples of each report graph.


